EXECUTIVE SUMMARY
|
In short:
|
- Australia’s data analytics market was valued at AUD 2.51 billion in 2025 and is forecast to reach AUD 23.94 billion by 2035 — yet most Australian businesses are still making critical decisions based on data that is hours or days out of date.
|
- Static dashboards and manual reports cannot keep pace with the speed modern businesses operate. By the time a problem surfaces in a weekly review, the window for a low-cost fix has already closed.
|
- AI-Powered Analytic Dashboards change the equation entirely — surfacing live insights, flagging anomalies automatically, enabling plain-English data queries, and turning your raw business data into decisions your team can act on right now.
|
|
|
What’s next?
|
|
Australian businesses that invest in AI-powered Data Visualisations and Analytic Dashboards Development today will be making faster, better-informed decisions than their competitors by next quarter — book your discovery session with C9 now before your next planning cycle begins.
|
|
→
|
You Have More Data Than Ever — And Less Clarity Than You Need
|
Every week, your business generates thousands of data points. Sales figures. Customer behaviour. Inventory movements. Operational costs. Cash flow positions. The raw material for every major decision you will make this year is already inside your systems.
And most of it is invisible to you.
Not because it is hidden — but because the tools your team relies on to surface it were not built for the speed, complexity, or scale of a modern Australian business. Your monthly reports arrive after the month is over. Your dashboards refresh once a day. Your finance team spends three days building a pack that a board reviews for twenty minutes and acts on never.
This is the operational reality facing thousands of Australian businesses in 2026. And it has a solution.
AI-Powered Analytic Dashboards — designed and built by C9 — are changing how Australian executives see, understand, and act on their data. This article explains what you need to know, what is at stake if you wait, and what the path forward looks like.
|
AUD 2.51B
Australia data analytics market value in 2025
Expert Market Research (2025)
|
25.3%
Forecast CAGR for Australian data analytics to 2035
Expert Market Research (2025)
|
23×
More likely to acquire customers — data-driven organisations
McKinsey Global Institute
|
|
01
|
Your Business Is Flying Blind on Yesterday’s Data
|
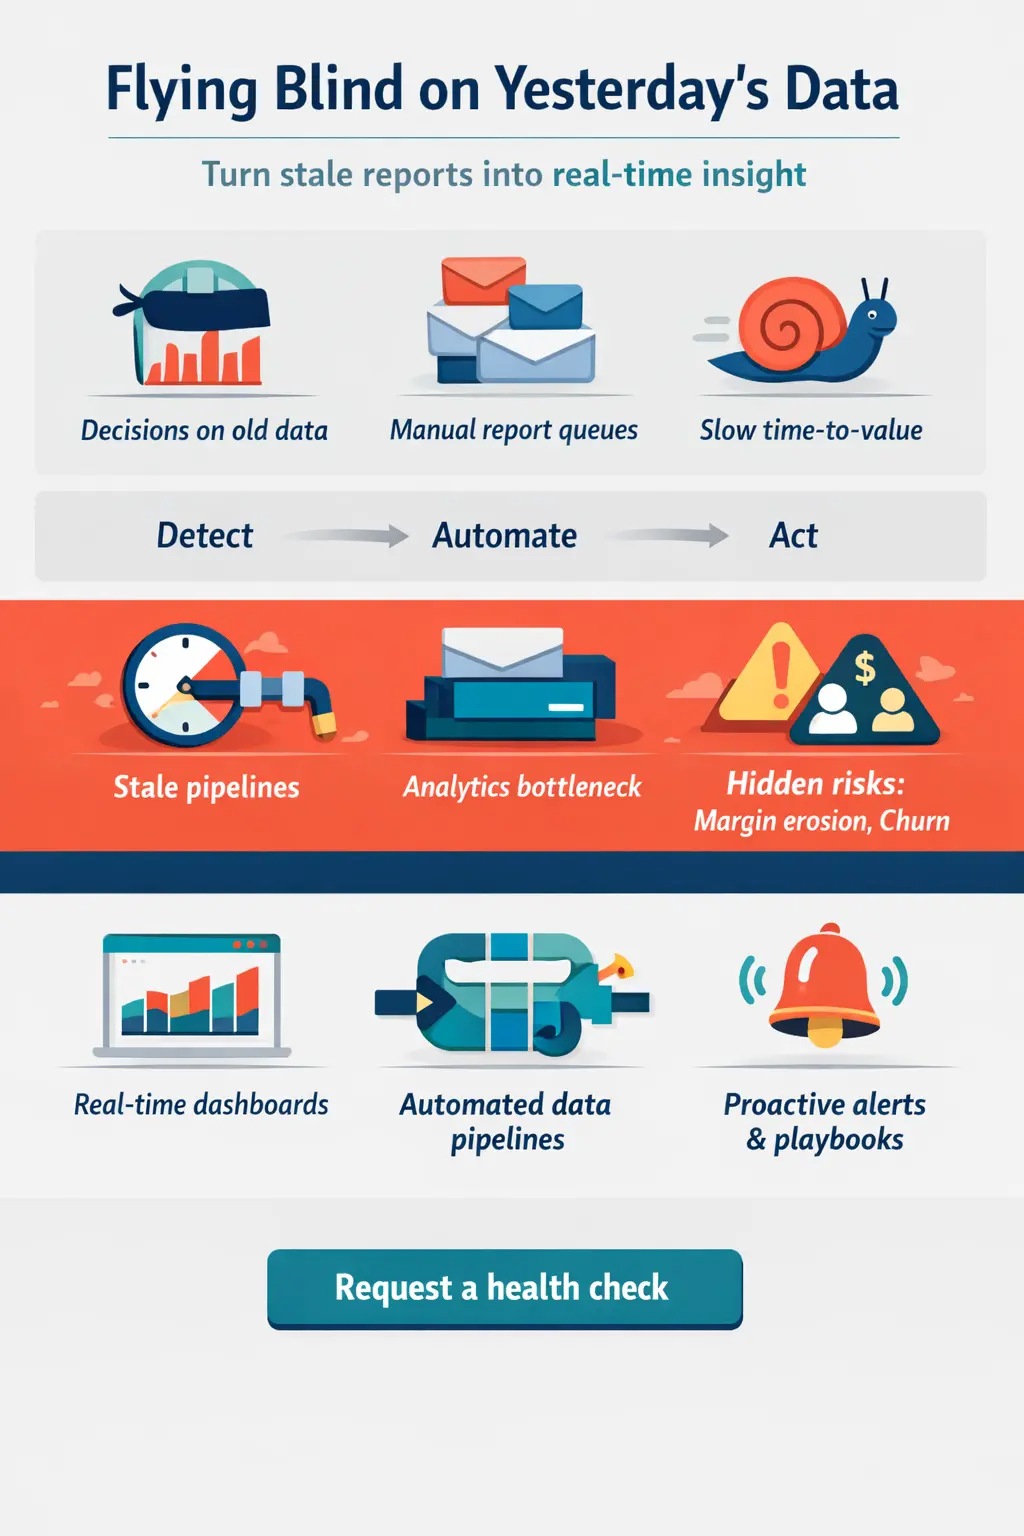
The Boardroom Is Reviewing History, Not Reality
Walk into any leadership meeting in an Australian business right now and you will see the same scene: senior decision-makers reviewing data compiled anywhere from 48 hours to four weeks earlier. Revenue summaries. Operational KPI decks. Customer satisfaction reports assembled by an analyst who pulled numbers manually from three different systems.
The charts are accurate. The insight is stale. And in a market where conditions shift weekly — where a competitor pricing move, a supplier disruption, or a customer churn cluster can reshape a quarter — making decisions on last week’s data is not a minor inconvenience. It is a strategic vulnerability.
Your Analytics Team Has Become a Bottleneck
Every time a department head needs a one-off report, a request lands in someone’s inbox. Days pass. The decision that needed data waits. Meanwhile, your highest-value technical people spend their time extracting, formatting, and distributing spreadsheets instead of solving the problems that actually require their expertise.
This is not a people problem. It is an infrastructure problem — and it scales badly. As your business grows, the queue grows with it.
Your Risks Are Invisible Until They Become Crises
Margin erosion. Inventory gaps. Customer churn accumulating in one segment. A cost overrun building quietly across a project. These events do not announce themselves. They develop gradually in data that no one is watching continuously.
By the time a problem surfaces in a monthly review, it has already compounded. The window for a low-cost response has closed. What should have been a two-week course correction becomes a quarter of damage control.
|
1,113
Data breaches reported to OAIC in 2024 — highest annual total since NDB scheme began in 2018
OAIC Notifiable Data Breaches Report (2024)
|
$4.26M
Average cost to Australian organisations of a single data breach in 2024
IBM Cost of Data Breach Report, cited by OAIC (2025)
|
25%
Rise in Australian data breach notifications from 2023 to 2024
OAIC (2025)
|
These figures are a reminder that the consequences of poorly governed analytics infrastructure extend well beyond missed insights. Under Australia’s Privacy Act 1988 and the Notifiable Data Breaches scheme, a misconfigured dashboard that exposes personal data carries serious financial and legal consequences. Building analytics correctly from the outset is not just best practice — it is risk management.
|
02
|
Why It Is Getting Worse: The Cost of Inaction Is Compounding
|
Your Competitors Are Already Investing
Across Australia, businesses in retail, healthcare, financial services, construction, and professional services are investing in custom Analytic Dashboards Development and AI-powered Data Visualisations — not as a technology experiment, but as an operational priority. They are detecting margin anomalies in real time. They are modelling the impact of pricing decisions before committing. They are giving field teams live visibility that enables faster, better responses to market shifts.
Every month you remain reliant on manual reports and static dashboards, analytically capable competitors widen their information advantage over you. The gap between data-rich and data-poor organisations does not narrow over time — it widens.
The Business Case Is No Longer Theoretical
The performance differential between data-driven and instinct-led businesses is well-documented and measurable. According to McKinsey Global Institute, data-driven organisations are 23 times more likely to acquire customers, six times as likely to retain customers, and 19 times more likely to be profitable than their peers. The same research identifies EBITDA increases of up to 25% for companies that build genuine analytics capabilities.
Meanwhile, Gartner’s top data and analytics predictions for 2026 state that half of all business decisions will be augmented or automated by AI agents. Organisations that build the data infrastructure now will be positioned to capture that capability. Those that wait will be building from behind.
|
19×
More likely to be profitable — data-driven vs instinct-led organisations
McKinsey Global Institute
|
25%
EBITDA increase demonstrated by companies with strong analytics capabilities
McKinsey, cited in MIT Technology Review (2024)
|
50%
Of business decisions forecast to be augmented or automated by AI agents
Gartner Top D&A Predictions (2026)
|
Off-the-Shelf Tools Are Failing Australian Businesses
Many Australian businesses have already invested in generic BI tools — Power BI configurations, Tableau templates, or SaaS dashboards that promised clarity and delivered complexity. The tools are not the problem. The problem is that globally-marketed software products were not built around your business.
Your specific KPIs, your data sources, your Privacy Act 1988 obligations, your Australian Consumer Law compliance requirements, your industry-specific reporting frameworks — none of these are priorities in a product designed for the broadest possible global market. The result: a tool your team barely uses, displaying metrics that almost answer the questions your leaders actually need answered.
A partial answer to the wrong question is not insight. It is noise that erodes confidence in your analytics investment.
|
03
|
AI-Powered Analytic Dashboards Built for Your Business
|
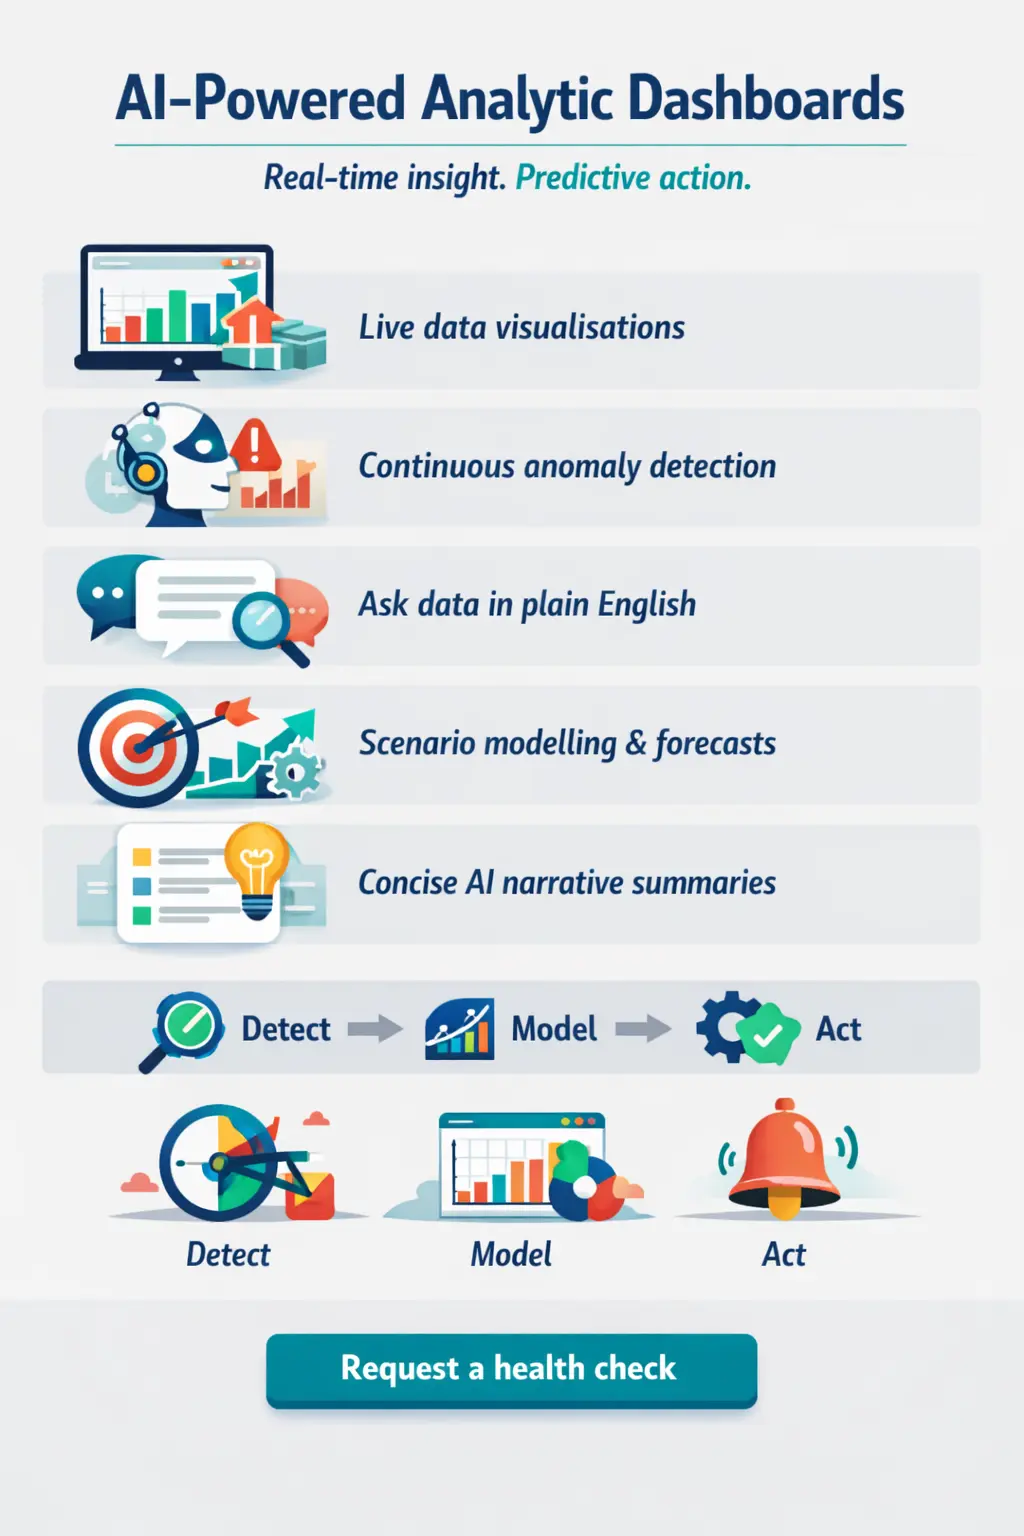
An AI-Powered Analytic Dashboard is not a better-looking spreadsheet. It is a fundamentally different relationship between your business and its data. Where a traditional dashboard shows you what happened, an AI-powered dashboard tells you what is happening now, why it is happening, and what is likely to happen next.
1. Live Data Visualisations That Update in Real Time
Your revenue, operational performance, customer activity, and cost metrics are displayed as they change — not as they were 24 hours ago. Your team always sees the current state of the business. Field managers on site, executives between meetings, and board members preparing for governance discussions all access the same live, trusted picture.
2. AI Anomaly Detection That Works While You Sleep
AI systems embedded in your dashboard monitor your data continuously. The moment a metric deviates from its expected range — a margin compression beginning mid-week, an inventory threshold approaching, a churn signal emerging in one customer cohort — the right person in your organisation receives an alert. Not at the next review. Immediately.
This capability alone transforms the relationship between your leadership team and operational risk. Discovering a problem in Week 2 instead of Week 13 gives you eleven weeks to respond. It is the difference between a course correction and a recovery.
3. Natural Language Queries That Democratise Data Access
Rather than navigating a BI tool’s filter system or waiting for an analyst, any member of your team types a plain-English question: “Which product categories underperformed in Queensland last quarter and why?” The system interprets the intent, queries the relevant data, and delivers a visualised, plain-language answer in seconds. No training required. No ticket raised.
This capability removes the bottleneck entirely. Every leader in your organisation becomes a self-sufficient data user — and your analytics team is freed to focus on the genuinely complex work that requires human expertise.
4. Predictive Scenario Modelling for Forward Visibility
AI-powered Analytic Dashboards do not just report the past. They model the future. A CFO can simulate the impact of a 4% increase in raw material costs on margin across every product line. A sales director can project quarterly revenue based on current pipeline velocity and conversion rates. An operations manager can model the effect of adding one delivery route on overall fleet efficiency.
These are not theoretical capabilities. They are operational tools that replace gut feel with evidence-based planning — and they are available to any Australian business that invests in the right analytics infrastructure.
5. AI Narrative Summaries That Replace 40-Slide Data Packs
Before your board sees a single chart, an AI-generated narrative summary tells them in three sentences what the data shows, why it matters, and what it suggests. Your leadership meetings become conversations about decisions — not exercises in interpreting slides prepared by someone who is not in the room.
|
“The businesses we see winning with data in 2026 are not the ones with the most data — they are the ones that have built the infrastructure to act on it faster than anyone else.”
— Rita Sallam, Distinguished VP Analyst, Gartner Data & Analytics Summit, Sydney 2025
|
|
04
|
Why C9: Australia’s Custom Analytics Development Partner
|
C9 is Australia’s leading custom software, apps, integration, and database developer. We do not configure off-the-shelf tools and call it a solution. We engineer bespoke Analytic Dashboards, Data Visualisation platforms, and Web Portals from the ground up — built around your data environment, your KPIs, your compliance obligations, and your team’s specific decision-making needs.
Built for Australian Compliance From the Ground Up
When C9 designs an Analytic Dashboard or Web Portal for an Australian business, Privacy Act 1988 compliance is not an afterthought — it is a first principle. Row-level security enforced at the database layer, data sovereignty with infrastructure hosted in Australian data centres, comprehensive audit logging, and data minimisation at ingestion are standard elements of every engagement — not optional extras.
Australia’s regulatory environment is not the same as North America’s or Europe’s. We understand the obligations your business operates under. We build analytics infrastructure that works within them.
Custom-Built Means It Works the Way Your Business Works
No two businesses are the same. A construction company’s project controls dashboard requires different architecture from a healthcare network’s operational portal or a professional services firm’s client billing dashboard. C9 starts every engagement with your business questions — not your data schema — and engineers a solution built around the decisions you actually need to make.
The result: dashboards your team uses, data your leaders trust, and insights that produce action rather than generate reports no one reads.
Our Analytic Dashboards Development & Web Portals Development Capability
- Real-time data pipeline integration connecting your ERP, CRM, financial systems, and operational databases into a single analytics layer
- AI-assisted anomaly detection and proactive alerting calibrated to your specific business metrics and thresholds
- Natural language query interfaces enabling non-technical staff to self-serve data insights without specialist training
- Role-based personalisation ensuring every user sees the metrics most relevant to their function and accountability
- Client-facing Web Portals delivering branded, secure, self-service analytics experiences to your customers or partners
- Mobile-first dashboard design ensuring your data is accessible wherever your team operates
- Privacy Act 1988-compliant data architecture with full audit logging and Australian data sovereignty
|
05
|
What Changes When Your Business Runs on AI-Powered Analytics
|
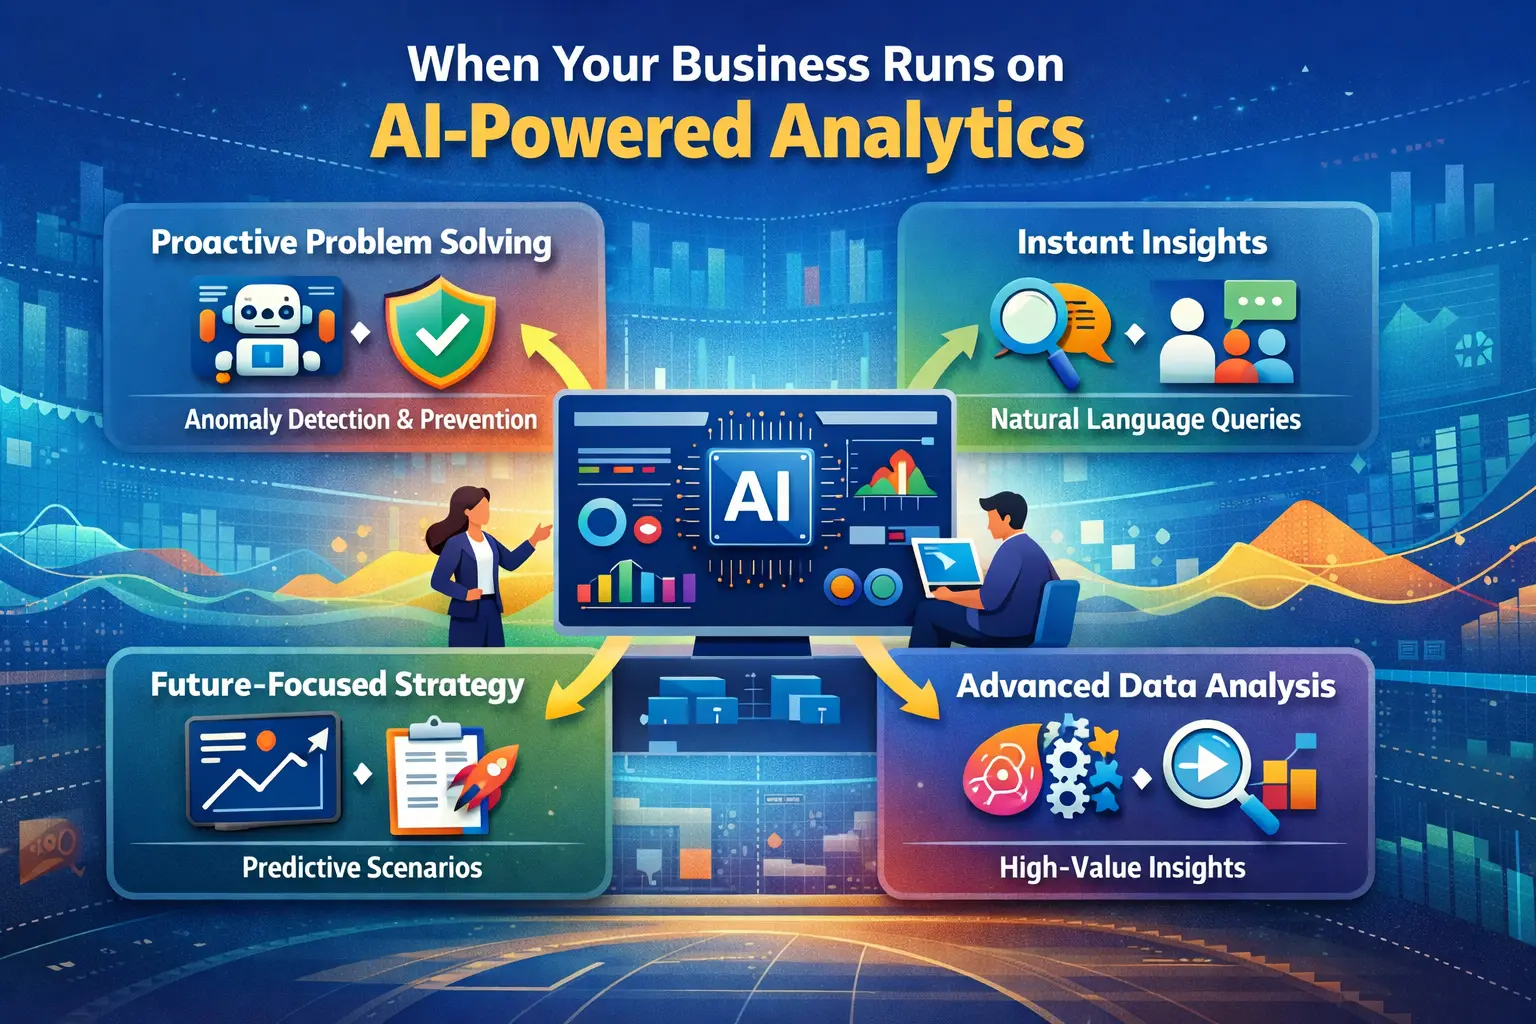
The shift from static reporting to AI-powered Analytic Dashboards and live Data Visualisations is not simply a technology upgrade. It changes how your entire organisation relates to data.
|
4×
More invested in D&A foundations by organisations with successful AI initiatives
Gartner Global Survey of 353 D&A Leaders (2026)
|
65%
Of enterprises regularly using generative AI in at least one business function in 2025
McKinsey State of AI Survey (2024)
|
39%
Of technology leaders confident their current AI investment will positively impact financial performance
Gartner Global Survey, Nov–Dec 2025
|
Your leadership team stops discovering problems and starts preventing them. When anomaly detection surfaces deviations the moment they begin, your leaders have weeks to respond rather than days to recover from a compounded issue.
Your operational managers stop waiting for reports and start self-serving answers. When natural language query interfaces are available to every team member, the analytics queue disappears. Decisions happen at the speed of the question.
Your board stops reviewing history and starts discussing the future. When AI narrative summaries and predictive scenario models are part of every board pack, governance conversations shift from backward-looking review to forward-looking strategy.
Your technical and analytics teams stop generating routine reports and start doing high-value work. When AI handles standard queries, your data professionals focus on complex, differentiated analysis that requires genuine human expertise.
|
✓
|
Conclusion: The Intelligence Advantage Is Available Right Now
|
The data your business needs to operate faster, respond smarter, and grow more confidently is already inside your systems. Australia’s data analytics market is expanding at 25% per year. AI capabilities that were experimental three years ago are now production-ready and delivering measurable competitive advantage for organisations that have invested in them.
Do not wait for your next quarterly review to discover a problem that has been building for three months. Do not let another planning cycle pass with your leadership team working from information that was already outdated when it was compiled.
The businesses that will lead their markets over the next three years are the ones that are building AI-powered analytics infrastructure now. C9 is the Australian development partner that builds it for them.
|
Book Your Free Discovery Session With C9
60 minutes. No obligation. Walk away with a clear roadmap for your business.
→ Contact C9 at c9.com.au →
Discovery sessions are limited each quarter — secure yours before your next planning cycle begins.
|
This is not a sales call. It is a strategic conversation.
At the end of it, you will know exactly what your data could be doing for your business — and what it takes to make that happen.
Your data is ready. Is your business?
Data Sources & References
C9 is committed to transparency in everything we publish. Every statistic and claim in this article is drawn from verifiable, publicly accessible primary sources. We encourage you to review these directly.
- Expert Market Research — Australia Data Analytics Market Size, Share & Forecast 2026–2035 (AUD 2.51 billion market value, 25.30% CAGR)
- McKinsey Global Institute — The Data-Driven Enterprise of 2025 (23× customer acquisition, 6× retention, 19× profitability)
- MIT Technology Review / McKinsey — Outperforming Competitors as a Data-Driven Organisation (EBITDA increases up to 25%)
- McKinsey — Charting a Path to the Data- and AI-Driven Enterprise of 2030 (65% of organisations using gen AI in at least one business function)
- Gartner — Top Data & Analytics Predictions for 2026 (boundaries between human, machine and organisational intelligence; 50% of decisions augmented by AI agents)
- Gartner — Organisations with Successful AI Initiatives Invest Up to 4× More in Data and Analytics Foundations (Global survey of 353 D&A leaders, Nov–Dec 2025)
- Gartner — Top D&A Predictions Announced at Data & Analytics Summit, Sydney (June 2025)
- Fortune Business Insights — Global Business Intelligence Market Size (USD 34.82 billion in 2025; projected USD 72.21 billion by 2034)
- Office of the Australian Information Commissioner (OAIC) — Notifiable Data Breaches Report July–December 2024 (1,113 breaches in 2024; 25% increase from 2023; highest since NDB scheme began)
- OAIC — Latest Notifiable Data Breach Statistics January–June 2025 (AUD 4.26 million average cost of a data breach; malicious attacks 59% of breaches)
- Business Research Insights — Business Intelligence and Analytics Market (65% of enterprises prioritising data-driven decision-making; 48% of solutions using AI-powered analytics)
- Research and Markets — Australia Data Analytics Market Forecast (USD 1.46B in 2024 to USD 10.22B by 2030; 38.1% CAGR)
Explore Related Insights on Dashboards & Web Portals Development Solutions
How a Bespoke Web Portal Can Reduce Operational Costs for Australian Enterprises
Microsoft Fabric and Power BI: The Ultimate Unified Analytics Platform for 2026
AI-Powered Predictive Analytics in 2026: How Australian Businesses Are Turning Data into Millions in New Revenue (Before Their Competitors Do)
Unlock Smarter Decisions: How AI-Powered Analytics and Copilot Integration in Power BI Transforms Australian Businesses
AI-Driven Custom Dashboards: Your 2026 Guide to Real-Time Business Intelligence
The ROI of Custom RPA: What Australian Businesses Need to Know in 2026
Why Australian Firms Need Low-Code Custom Software in 2026's Edge Computing Boom
Low-Code Speed vs. Custom Power: Choosing the Right Software Strategy for Your Australian Business
Strategic Microsoft Power Apps in Melbourne
Custom Microsoft Power Apps Development for Sydney
C9 is Australia’s leading custom software, apps, integration and database developer. We design and build bespoke Analytic Dashboards, Data Visualisation platforms, and Web Portals for Australian businesses that demand more than off-the-shelf answers. │ c9.com.au
AI Transparency Notice:
This article was produced with the assistance of artificial intelligence tools, including content drafting, visual asset creation, and audio generation. All content has been reviewed and approved by C9 prior to publication.