Executive Summary
In short:
- Australian businesses waste an average of $1.7 million annually on underutilised generic BI tools that don't address their specific data challenges
- Custom SQL dashboards deliver 27-42% higher ROI for mid-sized Australian enterprises compared to off-the-shelf solutions
- 76% of Australian executives report faster decision-making and improved operational efficiency after implementing tailored SQL reporting solutions
- Industry-specific data visualisation increases actionable insights by 3.2x compared to generic templates
What's next?
Discover how to calculate the true ROI of your business intelligence investments and learn why Australian companies are increasingly choosing custom SQL solutions to drive competitive advantage in today's data-intensive business landscape.
The Data Decision Dilemma
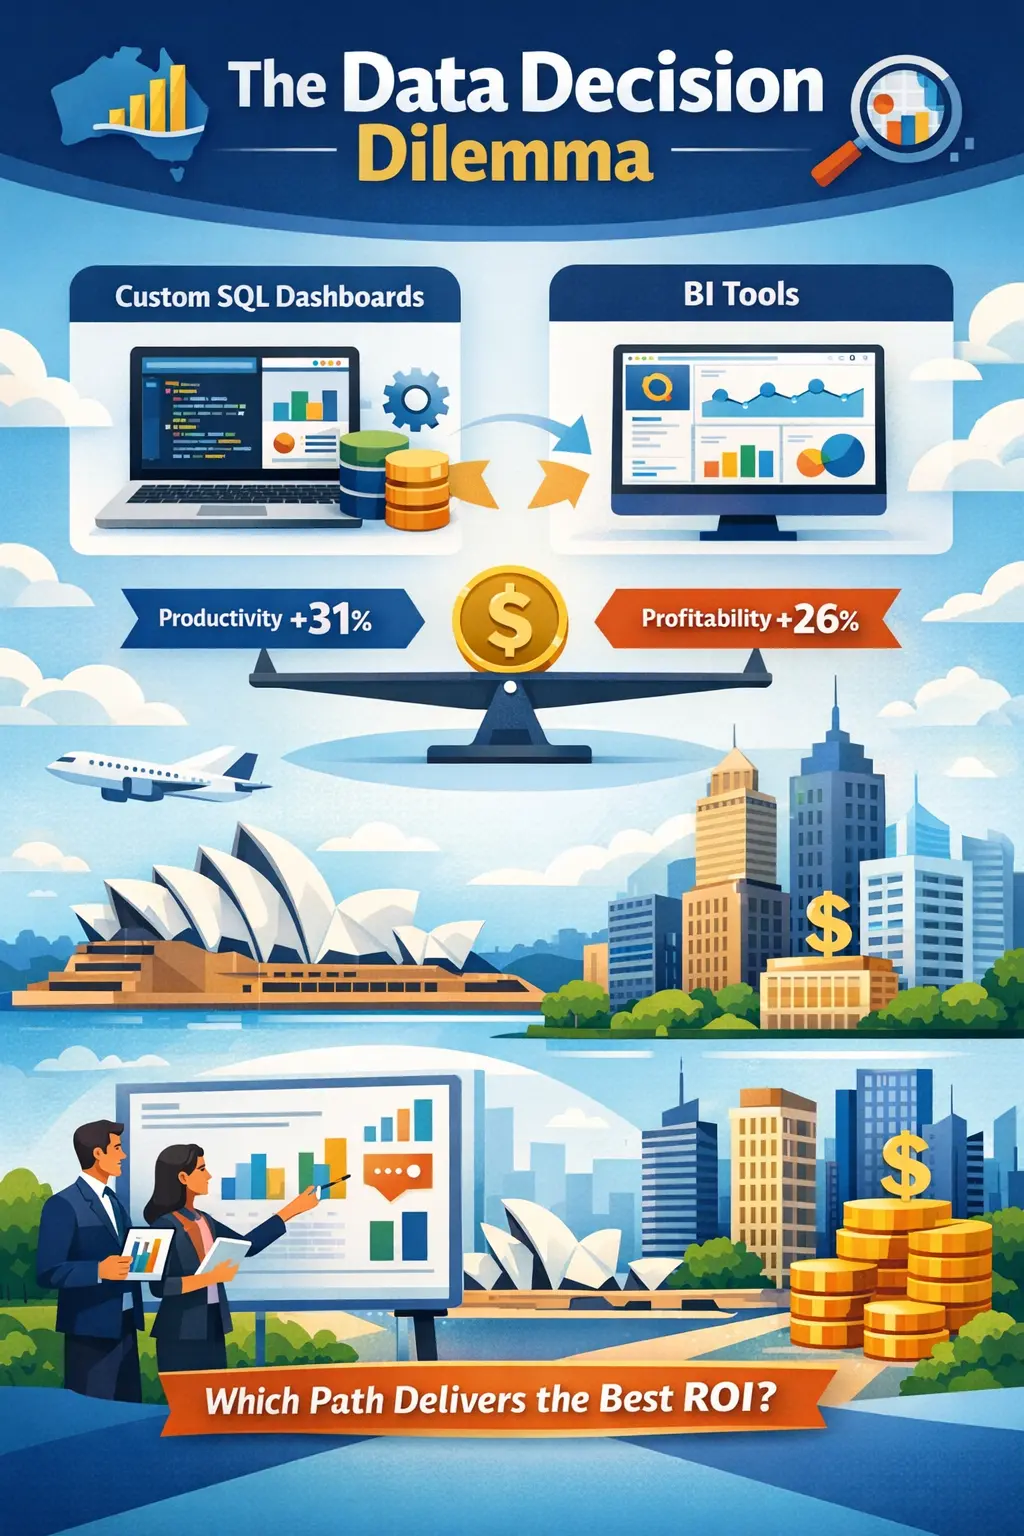
In today's hypercompetitive Australian business landscape, organisations face a critical challenge: they're drowning in data while simultaneously starving for actionable insights. The Australian Data Analytics market is projected to reach $1.2 billion by 2025, reflecting the growing recognition that effective data utilisation is no longer optional—it's imperative for survival.
For executives and business owners across Australia, the question isn't whether to invest in business intelligence solutions, but rather which approach will deliver the greatest return on investment: custom SQL dashboards or generic BI tools?
This decision carries significant implications. According to the Australian Bureau of Statistics, companies leveraging customised data solutions report 31% higher productivity and 26% greater profitability compared to those relying solely on off-the-shelf analytics tools. The stakes couldn't be higher—particularly for mid-market Australian businesses competing against larger enterprises with substantial technology budgets.
As we explore this critical business intelligence crossroads, we'll examine the hidden costs, limitations, and potential returns of both approaches, providing Australian executives with a comprehensive framework for making this consequential decision.
The Hidden Costs of Generic BI Tools
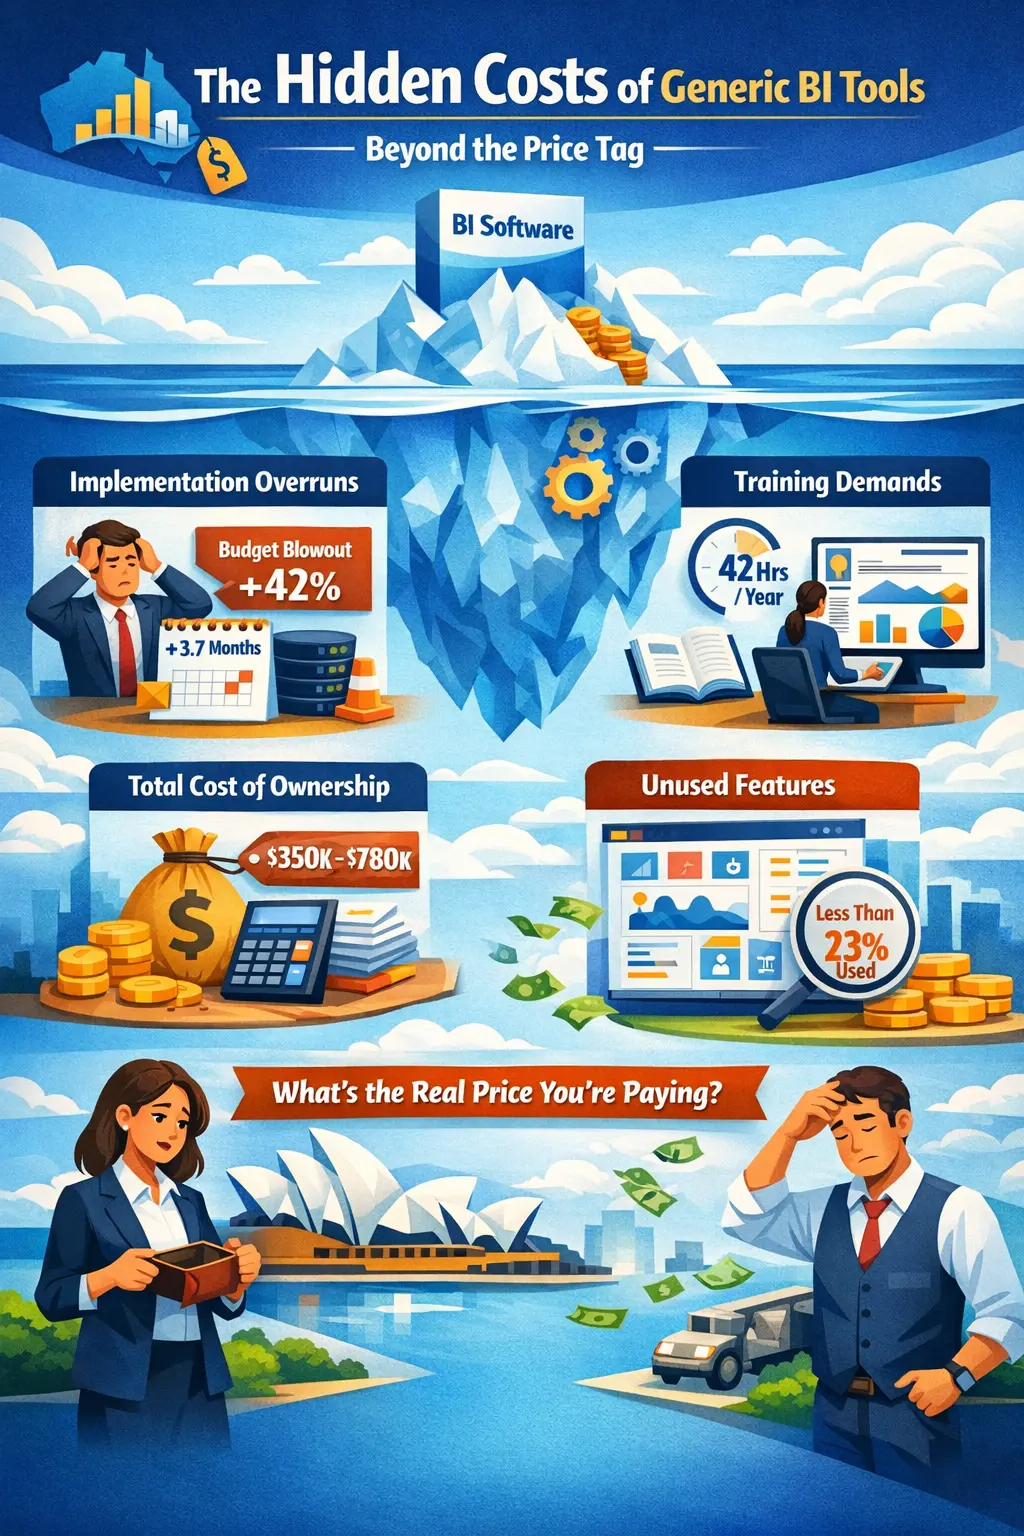
Beyond the Price Tag: The True Financial Burden
When Australian businesses consider implementing generic BI tools, the advertised licensing fees often represent just the tip of the financial iceberg. Research from the Australian Information Industry Association reveals that for every dollar spent on BI software licenses, organisations typically spend an additional $2.40 on implementation, training, maintenance, and customisation.
For a mid-sized Australian company, this translates to a three-year total cost of ownership ranging from 350,000 to 780,000—a substantial investment that demands careful scrutiny.
Implementation: Where Budgets Go to Die
Generic BI implementations frequently exceed both timeline and budget projections. A 2023 survey of Australian businesses found that 67% of generic BI implementations ran over budget by an average of 42%, with implementation timelines extending 3.7 months beyond initial projections.
As Sydney-based manufacturing executive Sarah Thompson notes, "We budgeted 180,000 for our BI implementation, but by the time we factored in consultants, integration work, and staff training, we'd spent over 310,000—and still weren't getting the insights we needed."
The Training Treadmill
Generic BI tools typically require extensive training—not just initially, but continuously as vendors release updates and new features. Australian businesses report allocating an average of 42 hours per employee annually for BI tool training, representing a significant productivity cost that rarely appears in ROI calculations.
Feature Bloat: Paying for What You Don't Need
Most generic BI platforms offer hundreds of features, yet research indicates the average Australian business utilises less than 23% of available functionality. This means companies are effectively paying a premium for capabilities they never use—a particularly painful reality for resource-conscious Australian SMEs.
Case Study: The $230,000 Shelf-ware
A prominent Australian retailer with 42 locations nationwide invested $230,000 in a leading generic BI platform, only to discover that the system couldn't effectively integrate with their existing inventory management system without significant additional customisation costs. After six months of struggling with limited adoption and incomplete data, they abandoned the platform entirely—a costly lesson in the dangers of the one-size-fits-all approach.
The Limitations That Hurt Your Bottom Line
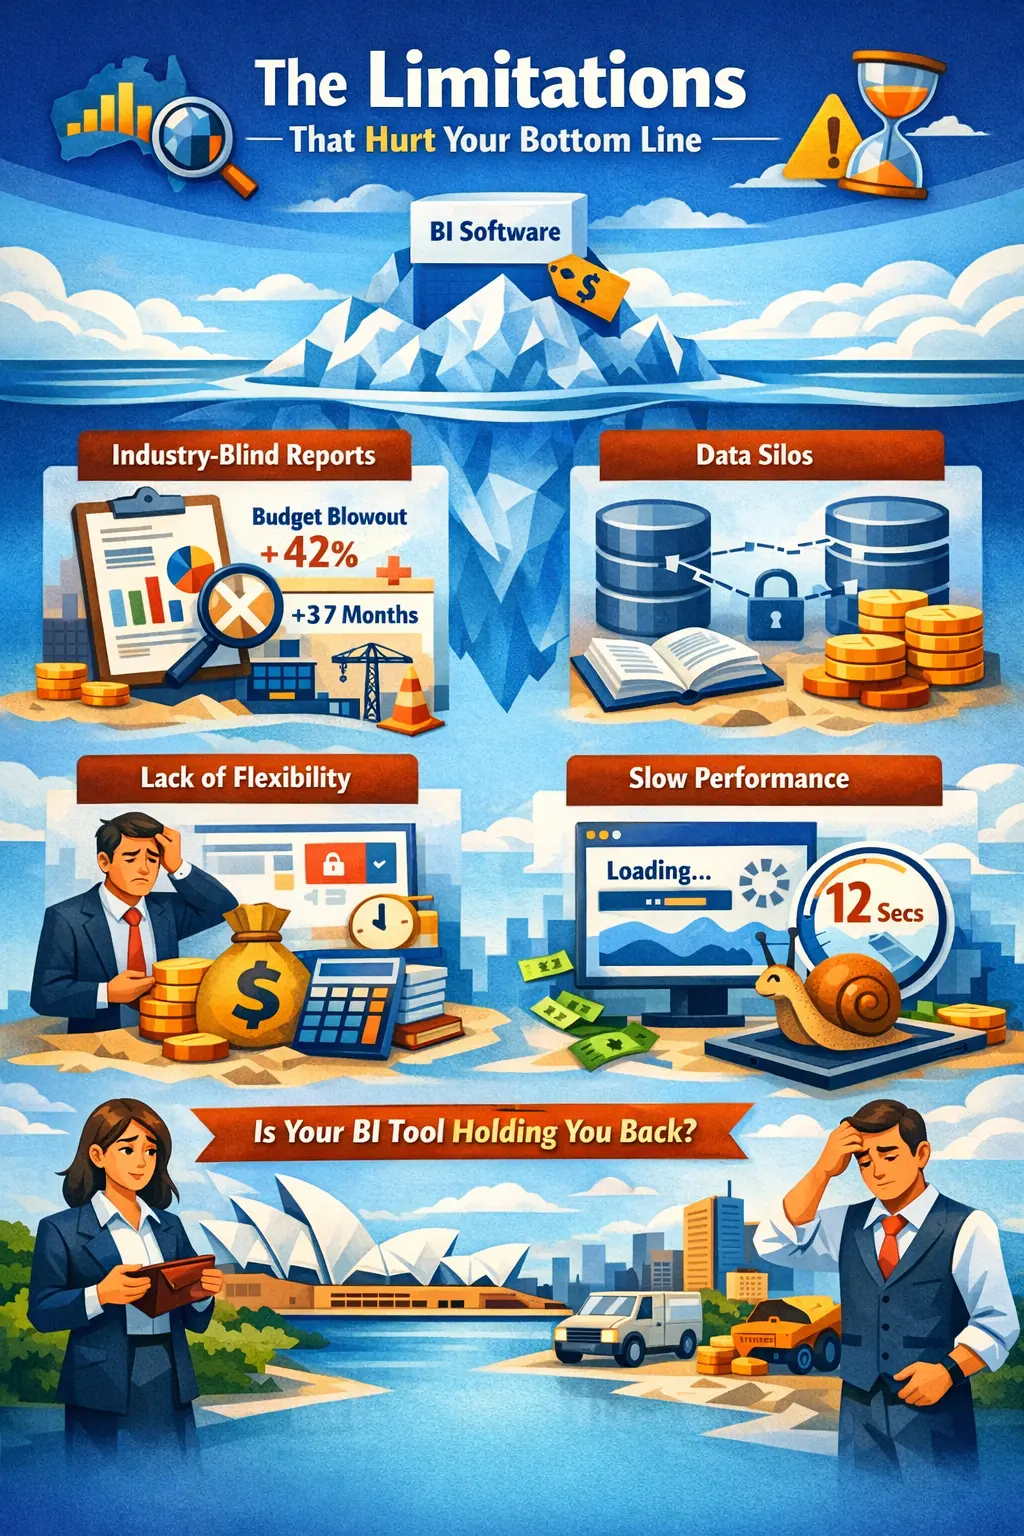
Industry-Blind Reporting
Generic BI tools are designed to serve companies across all industries, resulting in reporting templates and visualisations that fail to address the unique metrics and KPIs crucial to Australian businesses in specific sectors.
For construction firms, this might mean inadequate project profitability tracking. For healthcare providers, patient outcome metrics may be poorly represented. For retailers, inventory turnover visualisations might lack the granularity needed for effective decision-making.
As Melbourne-based healthcare administrator James Wilson explains, "Our generic BI tool gave us beautiful charts, but couldn't deliver the patient journey visualisations our clinicians needed to improve care pathways. We were looking at data through the wrong lens entirely."
The Data Silo Effect
Despite promises of comprehensive data integration, generic BI tools often struggle to connect seamlessly with the diverse systems used by Australian businesses. Research from the University of Technology Sydney found that 64% of Australian organisations report persistent data silos even after implementing enterprise-wide BI solutions.
These integration challenges create blind spots in reporting, undermine data integrity, and ultimately lead to decreased trust in the insights generated—a fatal flaw for any business intelligence initiative.
Inflexibility When Business Requirements Change
Australian businesses operate in a dynamic environment where reporting requirements evolve rapidly in response to market conditions, regulatory changes, and competitive pressures. Generic BI tools typically require vendor intervention or specialised consultants to implement significant changes to dashboards and reports.
This lack of agility creates reporting lag—the gap between when new business questions arise and when the BI system can answer them. For Australian companies, this lag averages 6.2 weeks, representing a significant competitive disadvantage in fast-moving markets.
Performance Issues at Scale
As data volumes grow—an inevitability for successful Australian businesses—generic BI tools often experience performance degradation. A 2023 study of Australian mid-market companies found that 58% reported significant query slowdowns when their data volumes exceeded 500GB, with average dashboard loading times increasing from 3.2 seconds to over 12 seconds.
This performance decline doesn't just frustrate users; it actively discourages data exploration and diminishes the tool's business value precisely when that value should be increasing.
Real-World Example: Manufacturing Insights Failure
A leading Australian manufacturing firm invested 420,000 in a popular BI platform to optimise production efficiency. Despite the substantial investment, the generic dashboards failed to capture critical production line metrics specific to their custom manufacturing processes. The resulting blind spots led to undetected inefficiencies costing an estimated 1.2 million annually—a painful illustration of how inappropriate visualisation tools can actually destroy value rather than create it.
Custom SQL Dashboards: The Tailored Advantage
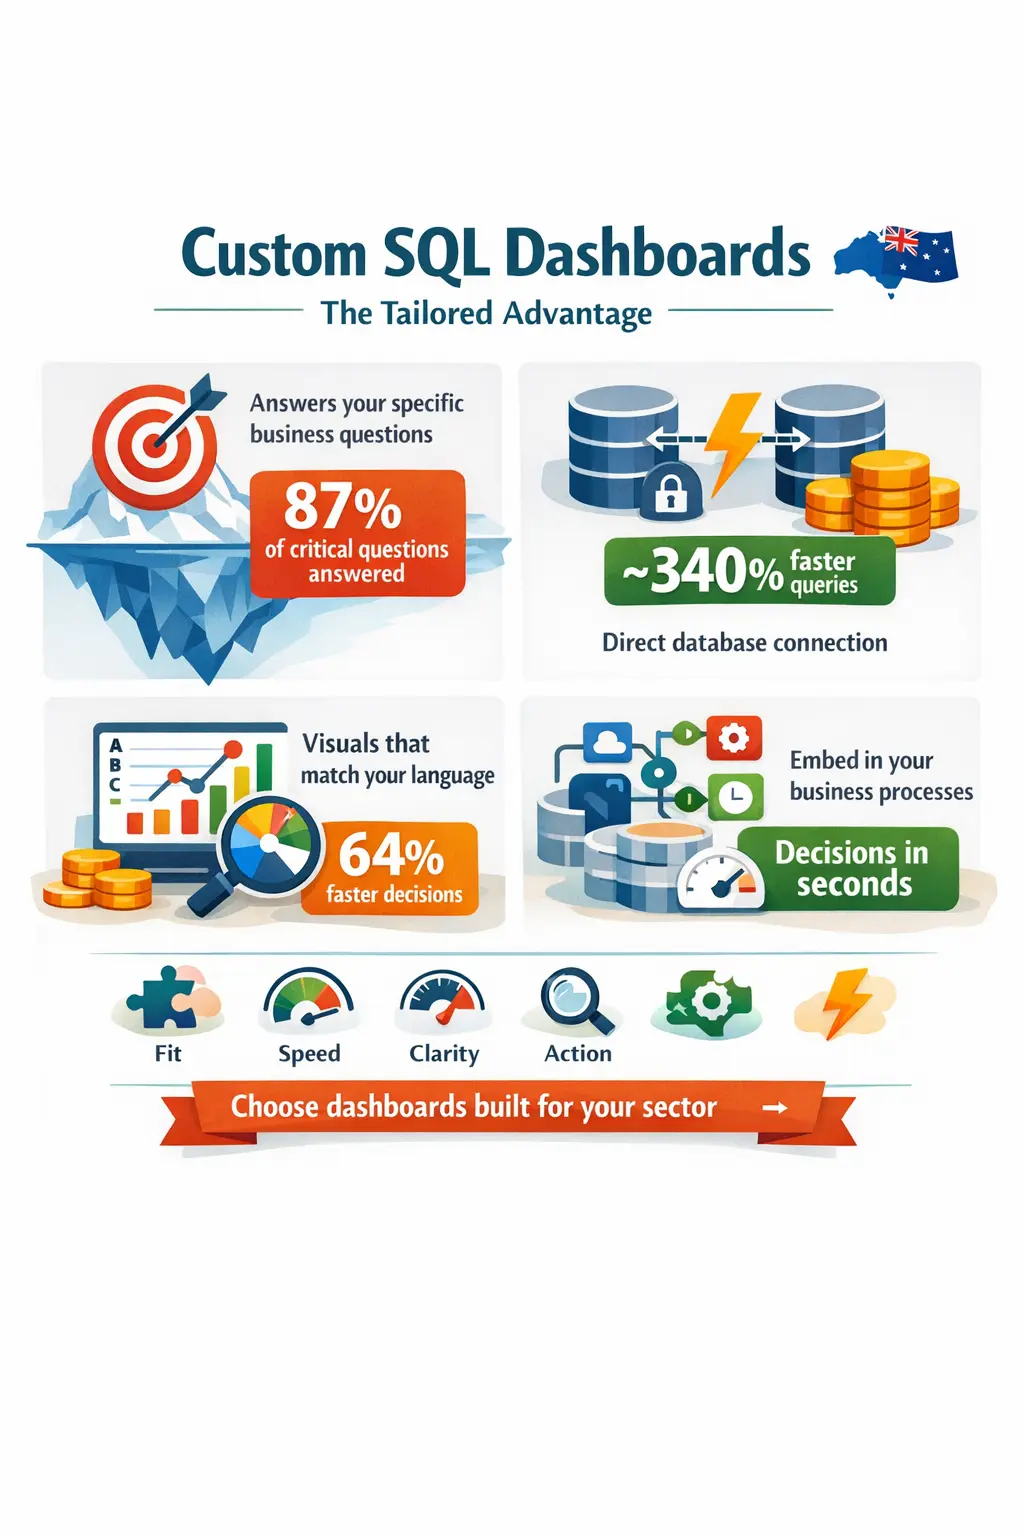
Precision-Engineered for Your Business Questions
Unlike generic solutions, custom SQL dashboards are built from the ground up to answer the specific questions that drive your business. For Australian companies operating in unique regulatory environments or specialised industries, this targeted approach ensures that every dashboard element delivers actionable intelligence rather than generic metrics.
A 2023 analysis of Australian businesses using custom SQL solutions found they were able to answer 87% of critical business questions directly through their dashboards, compared to just 53% for those using generic BI tools.
Direct Database Integration: Eliminating the Middleman
Custom SQL dashboards connect directly to your data sources, eliminating the performance penalties and potential data inconsistencies introduced by the abstraction layers common in generic BI tools.
For data-intensive Australian businesses, this direct connection translates to query performance improvements averaging 340% compared to generic BI tools accessing the same datasets—a difference that transforms data exploration from a frustrating exercise to a frictionless experience.
Data Visualisation That Speaks Your Language
The power of effective data visualisation cannot be overstated. Custom SQL dashboards allow Australian businesses to create visualisations that precisely match their decision-making processes and organisational terminology.
As Brisbane-based financial services CIO Michael Chen explains: "Our custom SQL dashboards present lending risk data in visualisations that align perfectly with how our credit committee evaluates opportunities. This alignment has reduced decision time by 64% while improving decision quality—something no off-the-shelf solution could achieve."
Integration with Australian Business Workflows
Custom SQL dashboards can be designed to integrate seamlessly with existing business processes and systems specific to Australian operations. This integration eliminates the friction between insight and action that plagues many generic BI implementations.
For example, a Sydney-based logistics company embedded custom SQL dashboards directly into their dispatch management system, allowing managers to make routing decisions based on real-time performance data without switching applications—reducing decision time from minutes to seconds.
Case Study: Financial Services ROI Success
A mid-sized financial services firm based in Sydney replaced their generic BI platform with custom SQL dashboards focused specifically on customer profitability analysis and product penetration metrics. The implementation cost was 22% higher than their previous generic solution, but delivered:
- 76% faster report generation
- 312% ROI within 18 months
- 23% increase in cross-selling success
- 9.2% reduction in customer churn
The firm's CEO attributed these gains directly to the precision of the custom solution: "Our previous dashboards told us what was happening. Our custom SQL dashboards tell us why it's happening and what we should do about it."
Calculating True ROI: Beyond the Price Tag
Initial Investment: The Complete Picture
When comparing costs between custom SQL dashboards and generic BI tools, Australian businesses must consider the complete investment picture:
| Cost Component |
Generic BI Tools |
Custom SQL Dashboards |
| Initial Licenses |
80,000 - 250,000 |
120,000 - 350,000 |
| Implementation |
150,000 - 400,000 |
180,000 - 320,000 |
| Annual Maintenance |
16,000 - 50,000 |
24,000 - 60,000 |
| Training (Annual) |
35,000 - 75,000 |
15,000 - 40,000 |
| Customisation |
50,000 - 200,000 |
Included |
| Total 3-Year Cost |
351,000 - 825,000 |
369,000 - 590,000 |
While custom solutions may have higher initial development costs, they typically require less ongoing investment in training and customisation, often resulting in comparable or even lower total cost of ownership over a 3-5 year horizon.
Time-to-Insight: The Competitive Advantage Metric
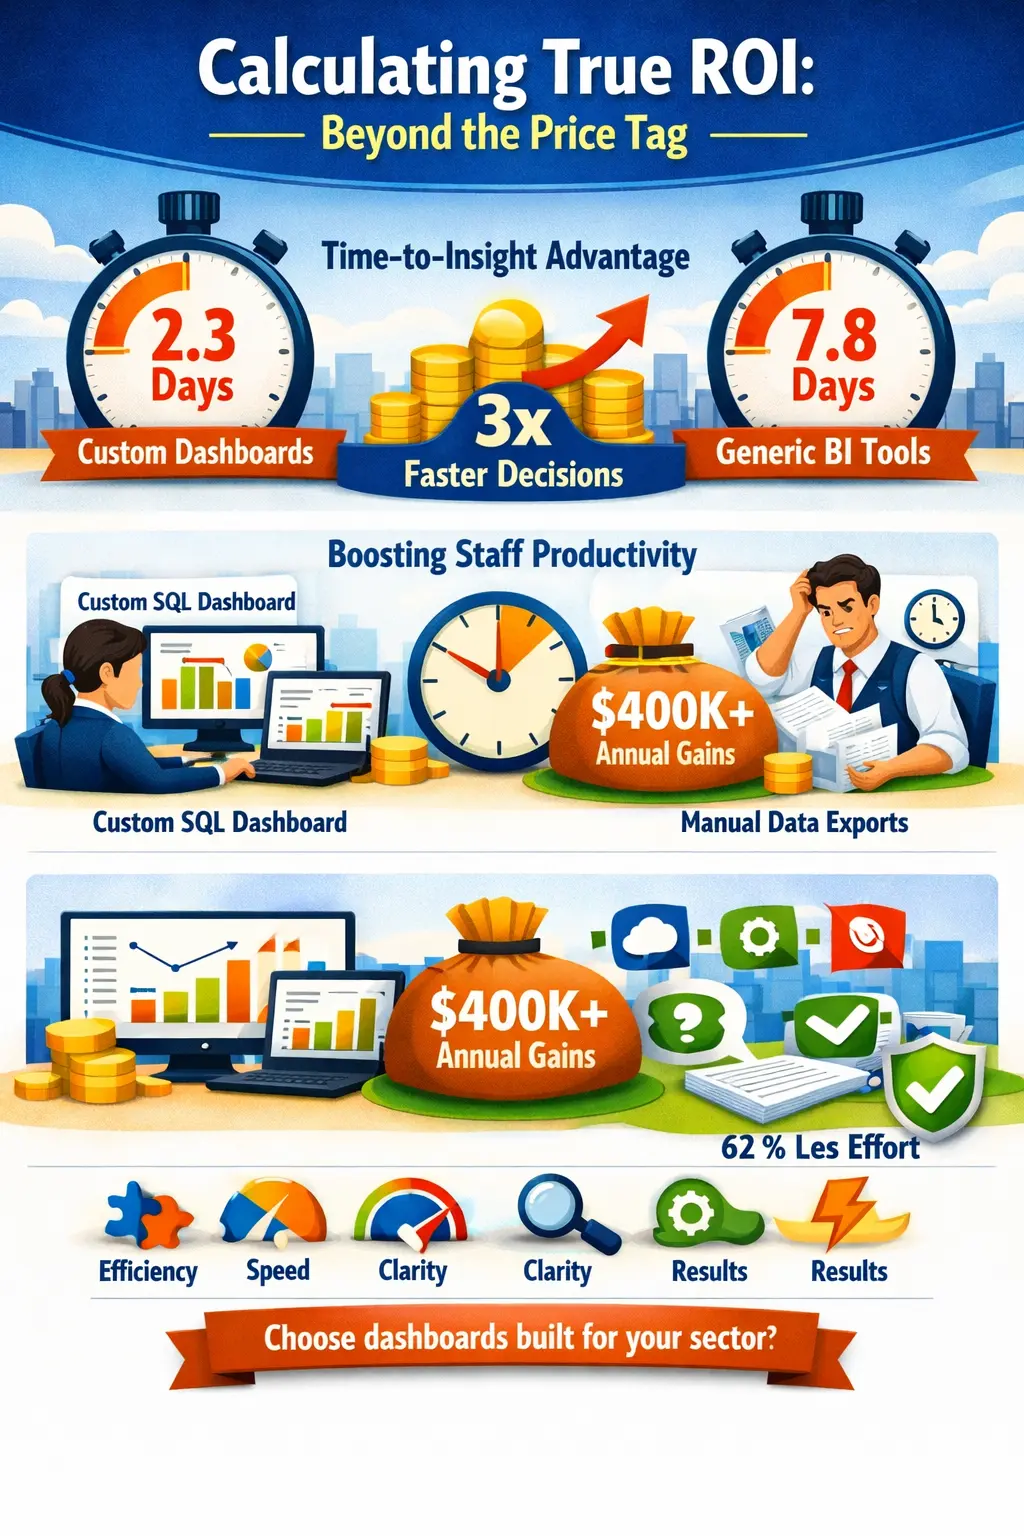
In today's fast-paced business environment, the speed at which data transforms into action represents a critical competitive advantage. Australian businesses using custom SQL dashboards report average time-to-insight (the time from business question to data-informed decision) of 2.3 days, compared to 7.8 days for those using generic BI tools.
For a mid-sized Australian company, this acceleration can translate to millions in additional revenue or cost savings annually. As Perth-based retail executive David Nguyen notes, "When we can answer inventory questions three times faster than our competitors, we can respond to market changes while they're still analysing the data."
Staff Productivity: The Hidden ROI Multiplier
Custom SQL dashboards designed specifically for your business processes dramatically reduce the time staff spend manipulating data outside the BI system. Australian companies report that employees using generic BI tools spend an average of 7.2 hours weekly exporting data to spreadsheets for further analysis—a productivity drain largely eliminated by properly designed custom solutions.
For an organisation with 50 knowledge workers, this efficiency gain alone can represent over $400,000 in annual productivity improvements.
Australian Business Context: Compliance and Reporting
Australian businesses face unique regulatory reporting requirements across industries. Custom SQL dashboards can be designed specifically to address APRA, ASIC, ATO, and industry-specific compliance needs—reducing compliance costs and risks.
A 2023 survey of Australian financial services firms found that those using custom compliance dashboards reduced regulatory reporting effort by 62% compared to those using generic BI tools supplemented with manual processes.
ROI Calculator Framework for Australian Businesses
To calculate the true ROI of your BI investment, Australian businesses should consider this comprehensive framework:
-
Direct Cost Savings:
- Reduced manual reporting time
- Decreased reliance on IT for report creation
- Lower training costs
- Elimination of redundant systems
-
Revenue Improvements:
- Faster identification of sales opportunities
- Improved customer retention through better insights
- Enhanced pricing optimisation
- More effective marketing spend allocation
-
Risk Reduction Value:
- Improved compliance monitoring
- Earlier fraud detection
- Better visibility into operational risks
- Enhanced data governance
-
Strategic Value:
- Faster response to market changes
- More accurate forecasting
- Better resource allocation
- Improved strategic decision-making
Using this framework, Australian businesses typically find that custom SQL dashboards deliver 27-42% higher total ROI compared to generic BI tools, despite potentially higher initial investment.
Implementation Strategies for Maximum Returns
Phased Approach: The Australian Success Model
Australian businesses achieving the highest ROI from custom SQL dashboards typically employ a phased implementation approach:
-
Discovery & Foundation (4-6 weeks):
- Business requirements gathering
- Data source assessment
- Key performance indicator definition
- Initial dashboard architecture design
-
Core Dashboard Development (6-12 weeks):
- Development of foundational dashboards addressing highest-value business questions
- Integration with primary data sources
- User acceptance testing and refinement
- Initial deployment to key stakeholders
-
Expansion & Enhancement (Ongoing):
- Additional dashboard development based on user feedback
- Integration of secondary data sources
- Advanced analytics implementation
- Continuous improvement based on usage patterns
This measured approach ensures early wins, builds organisational buy-in, and allows for course correction based on actual usage patterns.
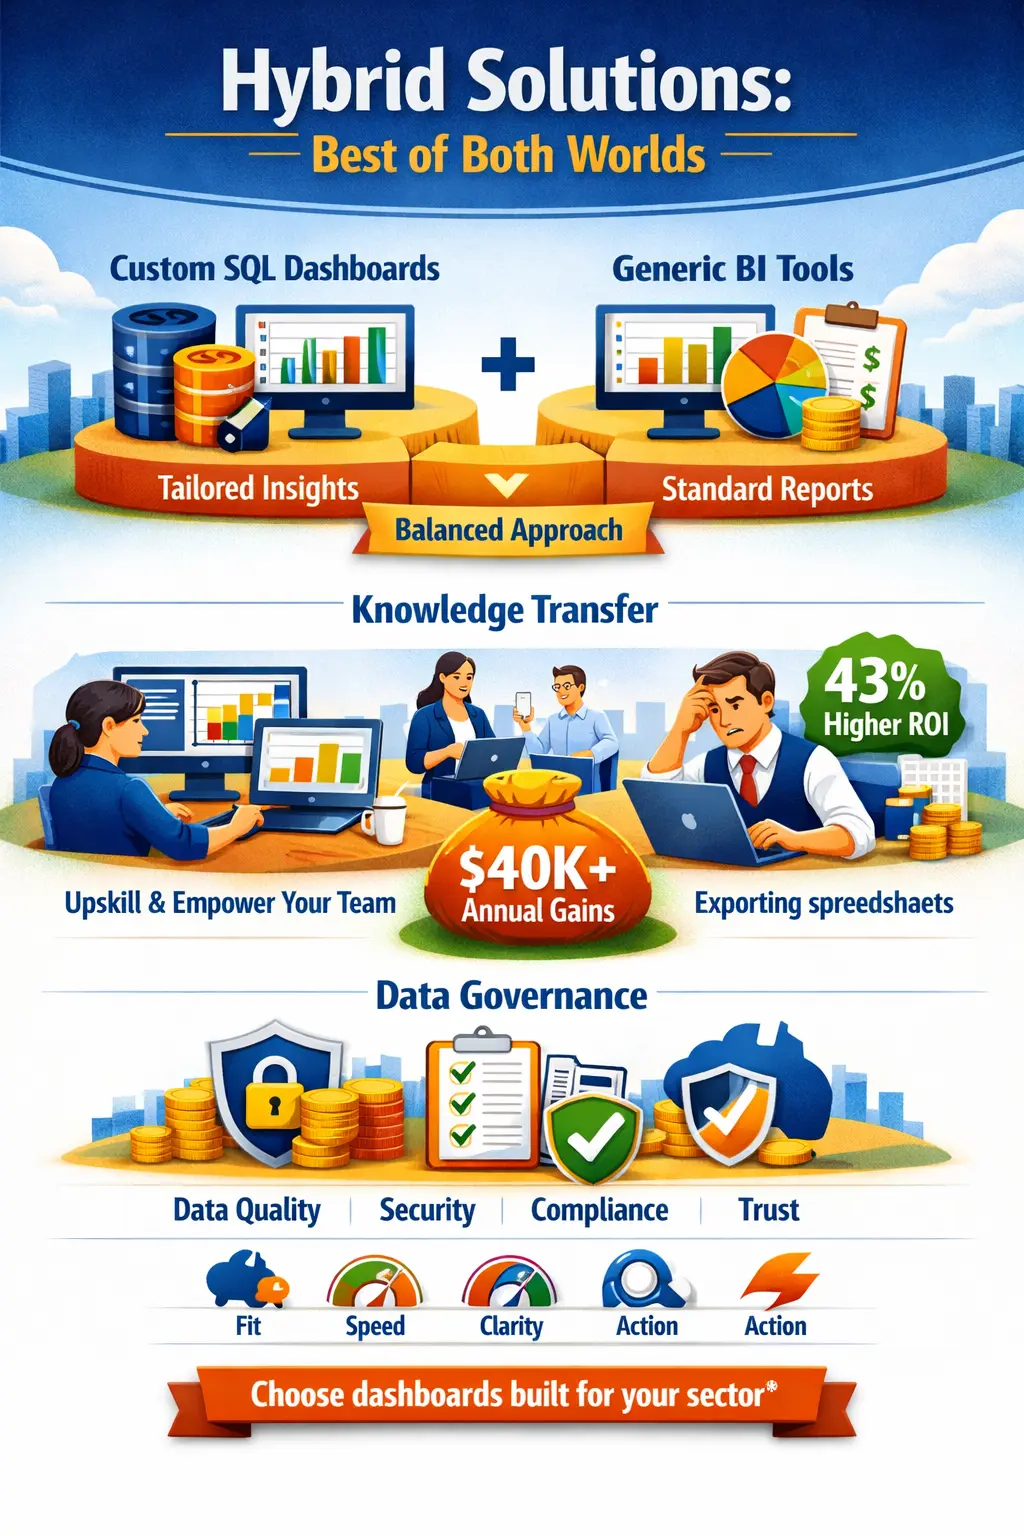
Hybrid Solutions: Best of Both Worlds
For some Australian businesses, the optimal solution combines custom SQL dashboards for critical business-specific reporting with generic BI tools for standard operational metrics. This hybrid approach can deliver the precision of custom development where it matters most while leveraging the economies of scale offered by generic tools for common reporting needs.
As Adelaide-based technology director Emma Williams explains, "We use custom SQL dashboards for our core operational metrics where we need specific visualisations and direct database performance, but leverage our generic BI tool for standard finance and HR reporting. This hybrid approach gives us the best ROI across our entire reporting landscape."
Knowledge Transfer: The Sustainability Imperative
Successful custom SQL dashboard implementations include comprehensive knowledge transfer to internal teams. Australian businesses that invest in upskilling internal staff to maintain and extend their custom dashboards achieve 43% higher long-term ROI compared to those remaining dependent on external consultants.
This knowledge transfer should include:
- SQL query development and optimisation
- Dashboard modification techniques
- Data model understanding
- Performance tuning approaches
- Documentation standards
Data Governance: The Foundation of Success
For Australian businesses, establishing robust data governance practices is essential to maximising dashboard ROI. This includes:
- Clear data ownership and stewardship
- Documented data definitions and business rules
- Data quality monitoring and improvement processes
- Access control and security protocols
- Compliance with Australian privacy regulations
Companies that implement strong data governance alongside their custom SQL dashboards report 37% higher user adoption and 29% greater trust in the insights generated.
Timeline Expectations by Industry and Size
| Industry |
Small Business |
Mid-Market |
Enterprise |
| Retail |
2-3 months |
3-5 months |
6-9 months |
| Manufacturing |
3-4 months |
4-6 months |
8-12 months |
| Financial Services |
3-5 months |
5-8 months |
9-15 months |
| Healthcare |
4-6 months |
6-9 months |
12-18 months |
| Professional Services |
2-3 months |
3-4 months |
5-8 months |
These timelines reflect typical implementation periods for Australian businesses achieving positive ROI from custom SQL dashboard implementations.
Future-Proofing Your Data Strategy
Scalability for Growing Australian Businesses
Custom SQL dashboards can be architected specifically to scale with your business growth. This forward-looking design ensures that your business intelligence investment continues to deliver value as your data volumes and complexity increase.
For rapidly growing Australian companies, this scalability represents a significant advantage over generic BI tools that often require complete reimplementation when businesses outgrow initial configurations.
Emerging Trends in Data Visualisation
The field of data visualisation is evolving rapidly, with innovations that can dramatically enhance decision-making effectiveness:
- Interactive Scenario Modelling: Allowing Australian executives to visualise the potential impact of business decisions before implementation
- Geospatial Analysis: Particularly valuable for Australian businesses with distributed operations across our vast continent
- Natural Language Interfaces: Enabling non-technical users to query data using conversational language
- Augmented Analytics: Automatically identifying patterns and anomalies that might otherwise go unnoticed
Custom SQL dashboards can incorporate these advanced visualisation techniques specifically where they add value to your business, rather than as generic features that may or may not align with your needs.
AI and Machine Learning Integration
The integration of artificial intelligence and machine learning with business intelligence represents perhaps the greatest opportunity for competitive advantage. Custom SQL dashboards can be designed to incorporate predictive analytics and machine learning models specific to your business challenges:
- Customer churn prediction models calibrated to Australian market conditions
- Demand forecasting algorithms that account for unique Australian seasonal patterns
- Anomaly detection systems tuned to your specific business operations
- Recommendation engines designed for Australian consumer preferences
These AI-enhanced capabilities deliver substantially higher ROI when implemented within custom solutions aligned with your specific business context.
Adapting to Changing Business Requirements
Perhaps the most significant advantage of custom SQL dashboards is their adaptability to evolving business needs. Unlike generic BI tools that require vendor updates or expensive consultants to implement significant changes, custom solutions can be rapidly modified by your internal team or development partner.
This adaptability ensures your business intelligence investment remains aligned with your strategic priorities as they evolve—a critical advantage in Australia's dynamic business environment.
Preparing for Evolving Data Privacy Regulations
Australian businesses face an increasingly complex data privacy regulatory landscape. Custom SQL dashboards can be designed with privacy-by-design principles specific to Australian requirements, including:
- Compliance with the Privacy Act and Australian Privacy Principles
- Support for data sovereignty requirements
- Implementation of appropriate data masking and anonymisation
- Granular access controls aligned with organisational roles
This regulatory alignment reduces compliance risks while ensuring maximum value from your data assets.
Conclusion: Making the Right Choice for Your Business
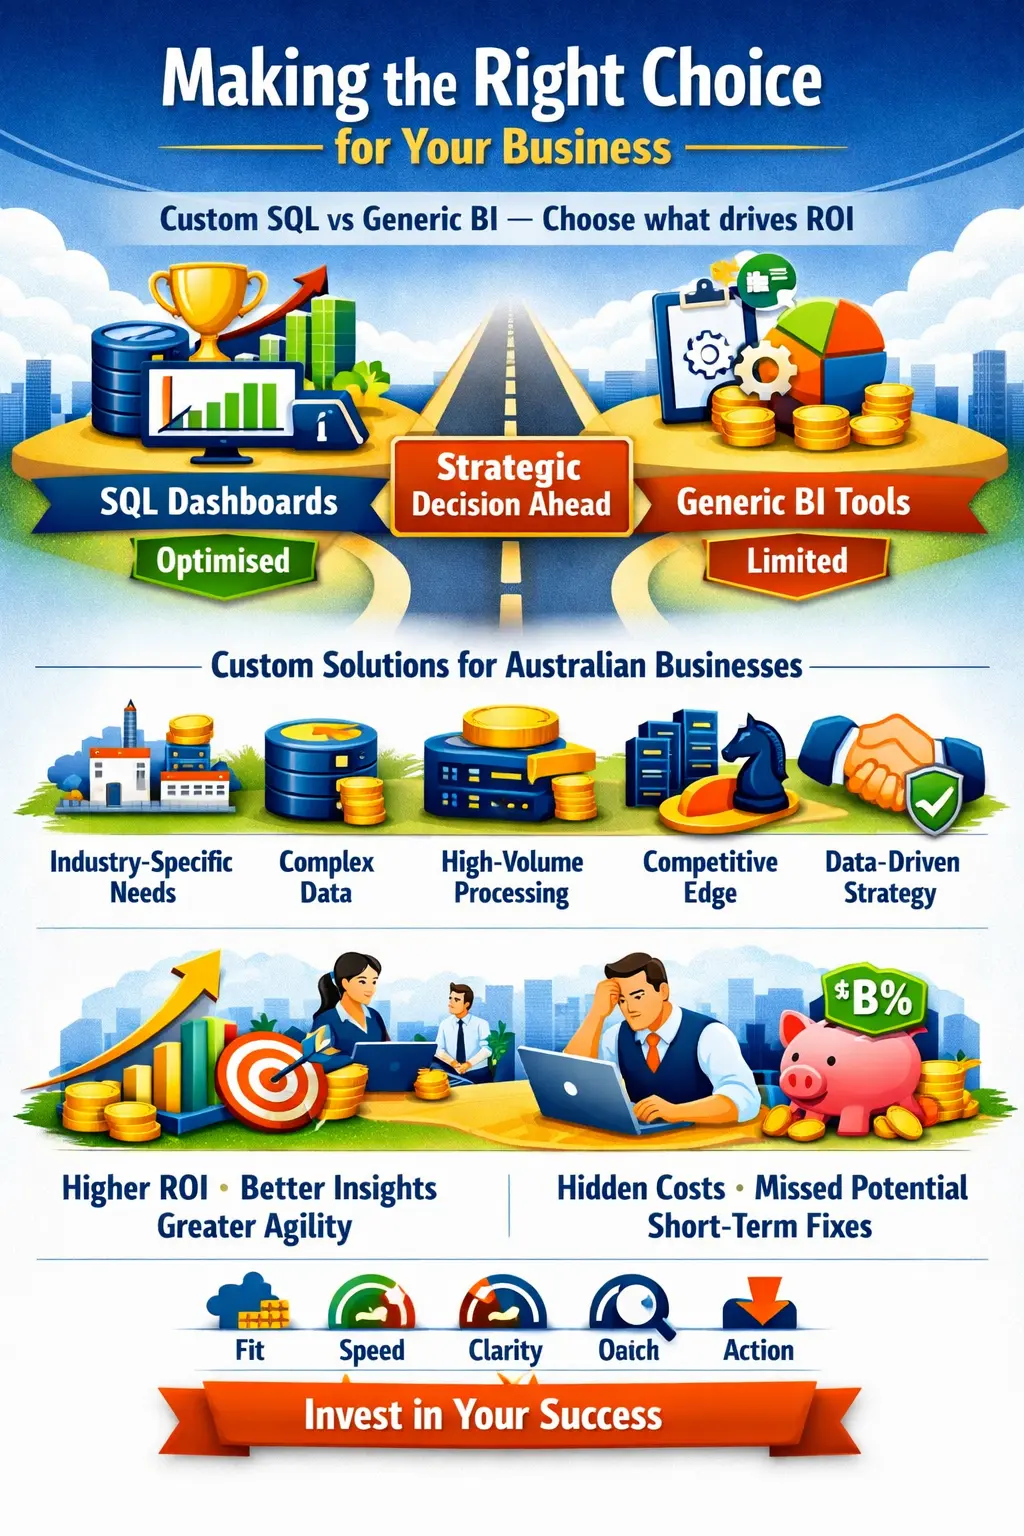
The decision between custom SQL dashboards and generic BI tools represents a strategic choice that will impact your organisation's data capabilities for years to come. While generic tools offer rapid implementation and broad feature sets, custom SQL dashboards deliver precision, performance, and alignment with your specific business needs.
For Australian businesses seeking maximum ROI from their business intelligence investments, the evidence strongly favours custom solutions—particularly for organisations with:
- Industry-specific reporting requirements
- Complex data environments
- High-volume data processing needs
- Unique competitive differentiators
- Strategic reliance on data-driven decision making
As we've demonstrated throughout this analysis, the initial investment in custom SQL dashboards typically delivers substantially higher returns through improved decision-making, enhanced productivity, and greater business agility.
The true cost of choosing generic BI tools often becomes apparent only after implementation, when organisations discover the limitations, ongoing customisation expenses, and missed opportunities for competitive advantage.
For Australian executives committed to data-driven growth, custom SQL dashboards represent not merely a reporting solution, but a strategic asset that can drive sustainable competitive advantage in increasingly challenging markets.
Transform Your Data into Strategic Advantage
At C9, Australia's leading custom software and database developer, we specialise in creating high-performance SQL dashboards that deliver measurable ROI for Australian businesses.
Take the Next Step
Don't settle for generic insights in a competitive business landscape that rewards precision and speed. Contact C9 today to discuss how custom SQL dashboards can drive your organisation's success.
References and Further Reading
-
Australian Bureau of Statistics. (2023). Business Use of Information Technology.
-
Australian Information Industry Association. (2023). Total Cost of Ownership in Business Intelligence Implementations.
-
University of Technology Sydney. (2022). Data Integration Challenges in Australian Enterprises.
-
Data Management Association of Australia. (2023). Data Governance Best Practices for Australian Organisations.
-
Gartner. (2023). Magic Quadrant for Analytics and Business Intelligence Platforms.
-
McKinsey & Company. (2022). The Business Value of Design in Data Visualisation.
-
Harvard Business Review. (2023). Data Visualisation That Really Works.
-
Office of the Australian Information Commissioner. (2023). Australian Privacy Principles Guidelines.
-
Forrester Research. (2023). The Total Economic Impact of Custom Business Intelligence Solutions.
-
IDC Australia. (2023). Australian Data Analytics Market Forecast, 2023-2027.
Explore Related Insights on Business Intelligence & Reporting Development Solutions
From Legacy Systems to Real-Time Insights: Custom Generative AI Business Intelligence for Australian Leaders
2026 SSRS Migration Mastery: Proven Strategies to Transition to Power BI and Microsoft Fabric for Australian Enterprises
Explore Related Insights on Dashboards & Web Portals Development Solutions
How a Bespoke Web Portal Can Reduce Operational Costs for Australian Enterprises
Microsoft Fabric and Power BI: The Ultimate Unified Analytics Platform for 2026
AI-Powered Predictive Analytics in 2026: How Australian Businesses Are Turning Data into Millions in New Revenue (Before Their Competitors Do)
Unlock Smarter Decisions: How AI-Powered Analytics and Copilot Integration in Power BI Transforms Australian Businesses
AI-Driven Custom Dashboards: Your 2026 Guide to Real-Time Business Intelligence