How Australian businesses transform forecasting from guesswork into data-driven strategy using custom unified dashboards
Executive Summary
69% of Australian sales operations leaders report that forecasting accuracy has worsened. Revenue data sits scattered across CRM platforms (Salesforce, HubSpot), marketing automation (Marketo, ActiveCampaign), product analytics (Amplitude, Mixpanel), and finance systems (MYOB, Xero). Unreliable predictions force sales leaders to waste up to 40% of their time reconciling conflicting spreadsheets instead of driving growth.
Custom-built unified forecasting dashboards create a single source of truth. Powered by AI-driven predictive analytics, they remove reconciliation overhead and deliver 30–90 day forward visibility into pipeline health, revenue trajectory and deal velocity. When built on structured discovery, these dashboards turn reactive guesswork into proactive, data-informed strategy.
Australian businesses avoid costly failures by investing in structured discovery before development begins. This guide explains why discovery is non-negotiable, how it maps decision points and realistic timelines, and why C9’s hybrid model (offshore specialists guided by Australian technical leadership) delivers knowledge transfer and predictable outcomes that generic offshore developers cannot match.
What You’ll Learn in This Guide
- Why forecasting accuracy is deteriorating for Australian sales teams
- The hidden costs of data fragmentation across CRM, marketing and finance systems
- How unified dashboards enable predictive forecasting (not just reporting)
- Why discovery calls prevent costly project failures
- How to identify and avoid cheap offshore “AI cowboys”
- Why C9’s blended hybrid model outperforms pure local and pure offshore teams
- Why 3–6 month staff augmentation contracts deliver better ROI than month-to-month arrangements
The Silent Revenue Killer Affecting 69% of Australian Sales Teams
Every quarter the same conversation plays out in boardrooms across Sydney, Melbourne, Brisbane and Perth. The VP of Sales presents a revenue forecast. Finance challenges the accuracy. Marketing cannot reconcile the numbers with their pipeline data. Operations questions why product analytics paint a different customer-health picture. By Friday nobody trusts the prediction — yet critical capital-allocation decisions worth millions of dollars are still made on that shaky foundation.
This is not unique to your organisation. Research shows 69% of sales operations leaders report forecasting accuracy has deteriorated in recent years. Even more concerning, 93% of sales leaders cannot forecast within 5% accuracy with only two weeks remaining in the quarter. For ASX-listed companies this creates governance and continuous-disclosure risk. For private-equity-backed businesses it undermines investor confidence.
The good news is that you can fix this within 60–90 days. Not by hiring more analysts or building bigger spreadsheets. By implementing a unified forecasting dashboard — a centralised, data-driven system that consolidates fragmented revenue data and enables true predictive visibility.
This guide explains why forecasting fails, what a properly built unified dashboard actually solves, and — most importantly — why a structured discovery process is the difference between a failed project and a revenue-predictability engine that compounds competitive advantage year after year.
Why Your Sales Forecasting Is Broken
The Data Fragmentation Crisis
Sales forecasting once meant reviewing a single Salesforce pipeline and applying sales-rep judgement. That approach was imperfect, yet at least the data lived in one place.
Today the data lives in seven or more systems, each reporting different numbers for the same metric:
- CRM (Salesforce, HubSpot, Pipedrive) — pipeline stages, deal size, close-date estimates
- Marketing automation (HubSpot, Marketo, ActiveCampaign) — lead scores, MQLs, account-based pipeline
- Product analytics (Amplitude, Mixpanel, Heap) — engagement, feature adoption, expansion signals
- Financial systems (MYOB, Xero, NetSuite) — actual closed revenue, churn patterns, CLV
- Customer-success platforms (Gainsight, Totango) — renewal risk, NRR, expansion opportunities
- Email and calendar systems — meeting attendance and stakeholder engagement patterns
When you try to forecast across these sources the conflicts appear immediately. Salesforce shows $2.3 million in qualified opportunities. HubSpot shows $1.8 million under different qualification criteria. Finance’s historical churn model trims the figure further. Customer success flags inactive enterprise accounts. Product analytics shows declining engagement in another cohort. Product launches planned for next quarter appear in none of the models.
Everyone is right — and no one is. Leadership teams therefore spend 15–20 hours every week reconciling spreadsheets, defending methodology and updating pivot tables instead of coaching reps, removing obstacles or closing deals.
The Real Cost to Australian Businesses
The financial impact is concrete:
- A 10% forecast error on a $50 million revenue business equates to $5 million in misallocated or missed investment each year.
- Sales leaders typically spend 35–45% of their time on forecast calls and reconciliation. At a $200,000 package that is $70,000–$90,000 of lost productivity per leader.
- Publicly listed companies face ASX continuous-disclosure obligations. Private-equity-backed firms face quarterly investor scrutiny. Forecasts that cannot be audited or reconciled create real governance risk.
Industry benchmarks place the annual cost of forecasting inefficiency for a typical Australian mid-market business between $150,000 and $500,000 — and often higher when mis-hired headcount, panic discounting and delayed strategic decisions are included.
Why the Problem Is Getting Worse
Data volume is growing faster than most organisations’ ability to interpret it. Five years ago a mid-market Australian business ran on a CRM and a spreadsheet. Today it has added marketing automation, product analytics, customer-success platforms and multiple integration tools. Each new system generates more data and more definitional conflicts.
When forecasts become unreliable, budgeting turns political. The department that tells the most compelling story — not the one with the most accurate data — receives the funding. Sales argues for headcount. Marketing argues for campaigns. Product argues for features. Finance mediates without a reliable single source of truth and defaults to “split the difference” or last-year proportional allocation. The result is a compounding cycle: inaccurate forecasts → political budgeting → poorly funded initiatives → even worse forecasts next cycle.
The most striking statistic remains the 93% accuracy crisis. With only 14 days left in a quarter — when most opportunities are already decided — nine out of ten sales organisations still cannot predict close revenue within a 5% margin. For a $50 million business forecasting $12.5 million quarterly, that 5% variance represents $625,000 of capital a CFO cannot confidently allocate on day 86 of a 90-day quarter.
This is not a sales-execution problem. It is a data-architecture problem.
The Solution — How Unified Forecasting Dashboards Fix It
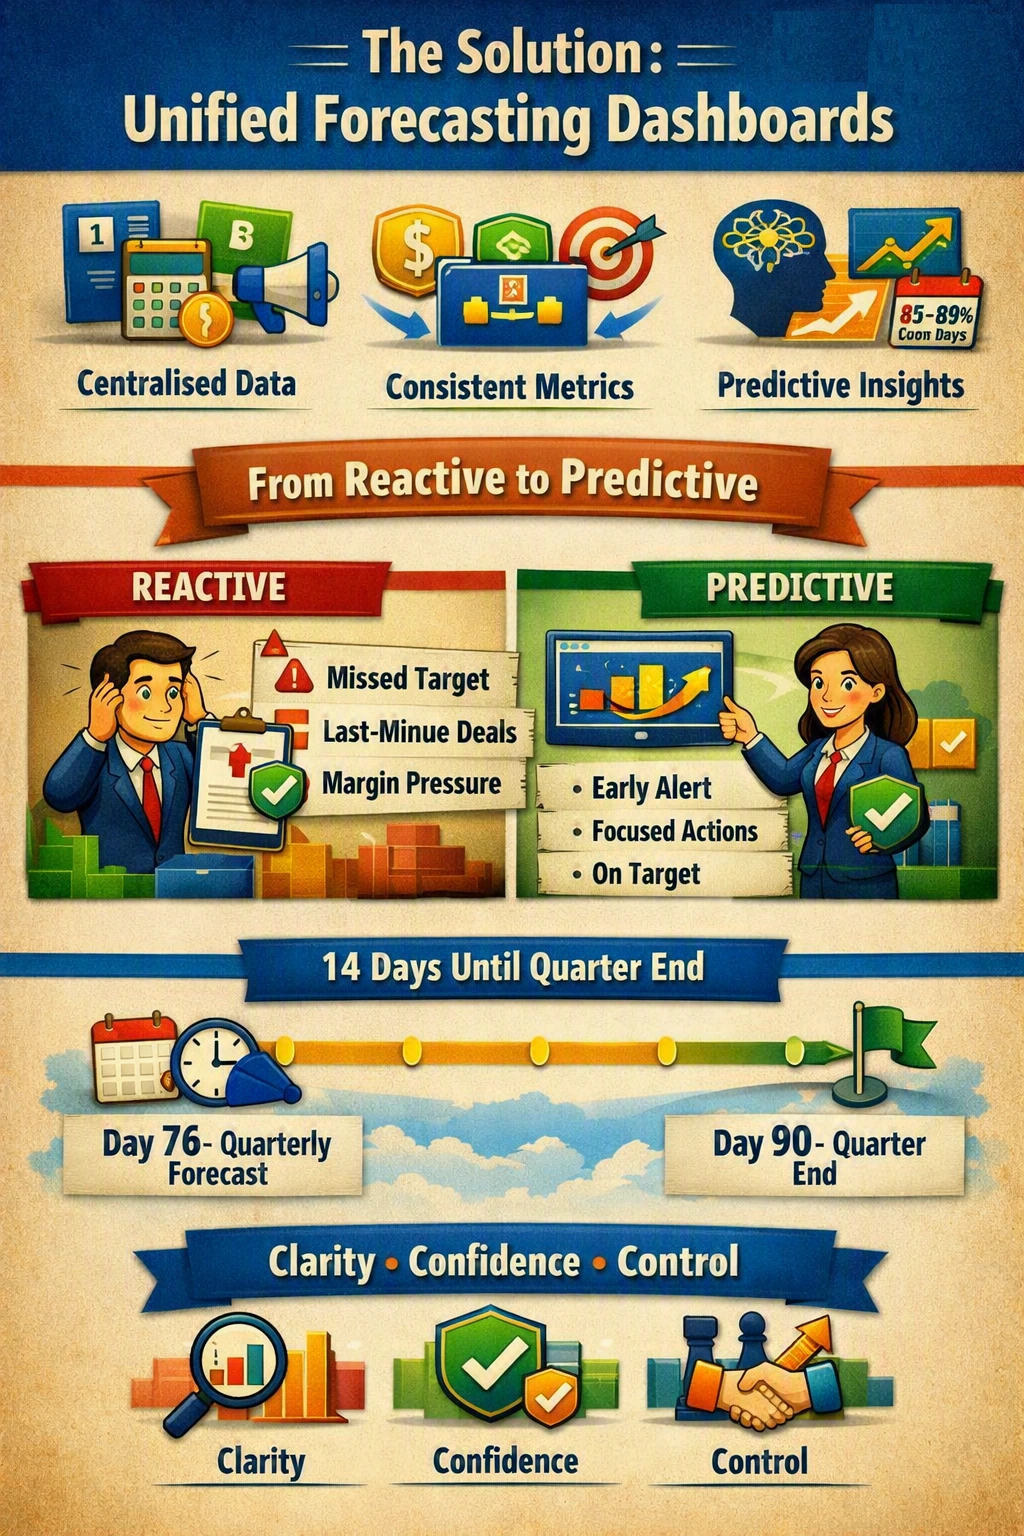
A properly designed unified forecasting dashboard does three things spreadsheets and point solutions cannot:
1. Centralises data from every source
Automated pipelines pull CRM, marketing, product, finance and customer-success data into one governed model. Sync frequency can be hourly, six-hourly or daily depending on criticality.
2. Eliminates reconciliation overhead
Shared definitions mean “closed revenue”, “qualified pipeline” and “expansion opportunity” mean the same thing to every stakeholder. Conflicts are resolved once, not every week.
3. Enables predictive forecasting, not just historical reporting
Machine-learning models analyse conversion rates, deal velocity, seasonal patterns, rep performance and external signals to project 30–90 day outcomes. Well-implemented predictive models routinely achieve 85–89% accuracy on clean data — a material improvement on the 65–75% accuracy typical of 90-day manual forecasts.
From Reactive to Predictive Leadership
Old approach (reactive)
Day 84 of the quarter: “We just closed $500k. We’re tracking 85% of target. We’re going to miss.” Crisis mode begins — emergency pipeline reviews, last-minute discounts, margin pressure.
New approach (predictive)
Day 70 of the quarter: Dashboard alert — “Current velocity and historical patterns indicate 92% of target. Close three of these seven high-probability opportunities and you reach 110%.” Leadership has 14 days of preparation time, targeted coaching and confident resource allocation.
That 14-day window of proactive control is the practical difference between a rear-view-mirror dashboard and a true forecasting engine.
Why Discovery Calls Are Non-Negotiable
C9 has delivered custom dashboards for hundreds of Australian organisations. The single most consistent pattern of failure is skipped discovery.
A typical request sounds like this: “We need a sales forecasting dashboard. We have Salesforce and three years of close rates in a spreadsheet. Can you build it in four weeks for $40k?” The technical delivery may be perfect. The business outcome is often zero — because the model does not incorporate marketing engagement scores, industry-specific seasonality, differing definitions of “qualified”, the expected refresh cadence, or expansion revenue sitting in the customer-success system.
The cost of that discovery failure is routinely $80,000–$200,000 in rework plus six months of lost time-to-value.
What Proper Discovery Actually Maps
A structured four-week discovery process maps three critical dimensions:
Decision points — Who needs what information, at what frequency, to make which decisions?
(CFO: quarterly capital allocation; VP Sales: weekly deal prioritisation; Customer Success: monthly renewal risk; Board: monthly variance reporting.)
Data sources and definitional conflicts — Where does each system’s “truth” live, and how do qualification criteria differ across CRM, marketing and finance?
Realistic scope, timeline and budget — What is the minimum viable product that delivers value in 12–16 weeks, and what belongs in phase two and three?
Discovery ROI Math
Discovery typically requires 3–4 weeks and 40–60 hours of stakeholder time (roughly $8,000–$15,000 internal cost). Skipping it frequently costs $80,000–$200,000 in rework. Discovery reduces project failure risk by approximately 90%. It is the highest-ROI investment in the entire initiative.
The “AI Cowboy” Warning — Why Cheap Offshore Builders Cost More
Australian businesses are frequently tempted by low-cost offshore “AI app builders” offering dashboards for $10,000–$20,000 in three to four weeks. These operators move fast, charge little and disappear before the real costs surface.
They typically provide no structured discovery, no knowledge transfer, limited accountability, weak security controls (raising Australian Privacy Act concerns), no scalability planning and no automated testing framework. The $15,000 dashboard often becomes a $100,000–$300,000 problem once reverse-engineering, emergency rebuilds, opportunity cost and compliance risk are added.
C9’s approach is deliberately different: full documentation, side-by-side knowledge transfer so your team owns the system, 12 months of post-launch support, and Australian technical leadership over every delivery.
Why C9’s Blended Hybrid Model Stands Out
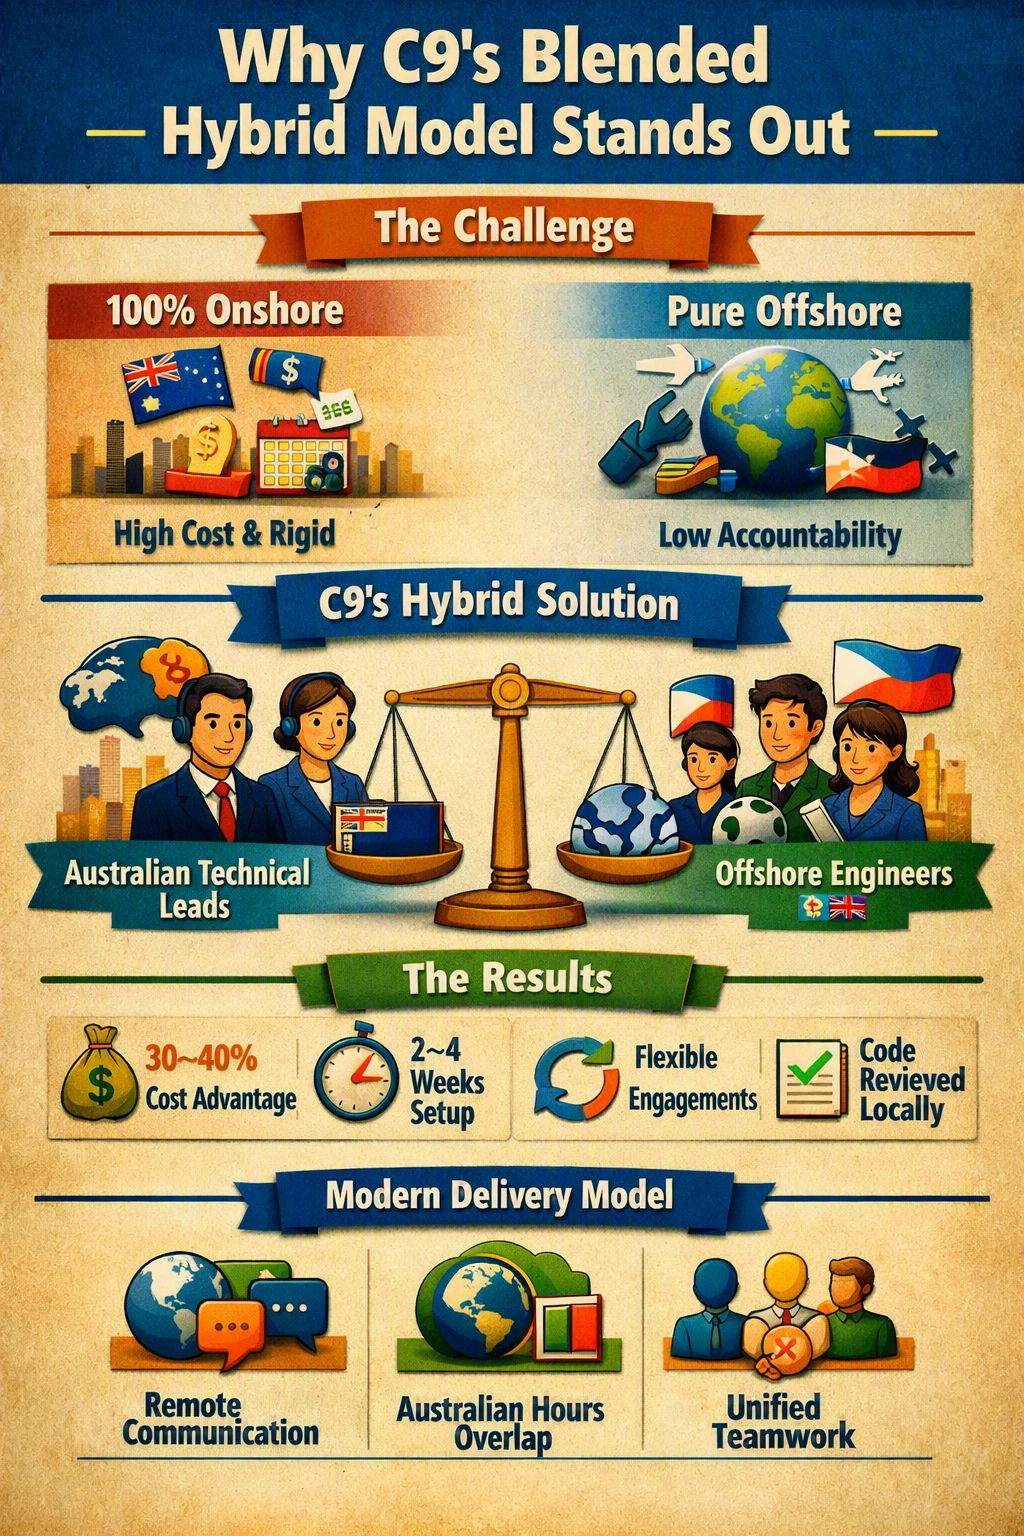
Most Australian agencies are 100% onshore (high cost, long lead times, rigid contracts) or pure offshore (low accountability, knowledge leakage). C9 maintains a carefully managed blend of specialist offshore engineers (Philippines, India, Eastern Europe) paired with Australian-based technical leads.
The result:
- 30–40% cost advantage versus pure local teams while retaining Australian accountability
- Team availability in 2–4 weeks rather than 3–6 months
- Flexible 3–6 month minimum engagements rather than 12-month lock-ins
- Every line of code reviewed by an Australian technical lead who understands local business culture and regulatory expectations
- Genuine knowledge transfer so your team can maintain and evolve the system independently
We build your internal capacity, not a black-box dependency. We send coordinated multi-disciplinary teams, not single points of failure. And we operate remote-first with asynchronous communication and scheduled Australian-hours overlap — modern product delivery, not traditional contractor presence.
Why 3–6 Month Staff Augmentation Beats the Alternatives
Three common models exist:
- Fixed-price project — high risk of scope change and cost overrun
- Month-to-month augmentation — continuous re-onboarding, contractor mentality, unpredictable total cost
- 3–6 month staff-augmentation engagement (recommended) — onboarding cost amortised, compounding knowledge velocity, team ownership and cost predictability
A typical forecasting-dashboard engagement with C9 sits for six months (one to two engineers plus Australian technical leadership, QA, infrastructure and 12 months of post-launch support).
Stop Forecasting Blind — Start Building with Confidence
69% of Australian sales leaders struggle because their data lives in silos and their processes remain manual. A unified forecasting dashboard solves the architectural problem — but only when it is built the right way: with proper discovery, knowledge transfer and a team that remains accountable after go-live.
The path forward is clear. Stop reconciling spreadsheets every week. Stop risking capital decisions on forecasts no one trusts. Stop gambling on low-cost builders who leave you with unmaintainable systems.
Your Next Step: Book a Free Discovery Call with C9
C9 specialises in custom forecasting dashboards and unified data platforms for Australian mid-market and enterprise organisations. In a free 45-minute discovery call we will:
- Map your current forecasting process and pain points
- Identify immediate quick wins
- Outline a realistic phased roadmap (MVP typically 12–16 weeks)
- Explain engagement model, team composition and transparent costing
Book at https://www.c9.com.au/Company/Contact with the subject line “Sales Forecasting Dashboard Discovery Call”.
Within 48 hours you will receive calendar options. By the end of the call you will have clarity on scope, timeline and investment — plus a documented forecasting roadmap whether or not you proceed with C9.
In Short
Data fragmentation across CRM, marketing, product and finance systems is the root cause of the 69% accuracy problem. Unified dashboards with predictive analytics restore a single source of truth and 30–90 day visibility. Structured discovery prevents the majority of project failures. C9’s hybrid model combines cost efficiency with Australian accountability and genuine knowledge transfer. A 3–6 month engagement delivers a system your team owns, supported for a full year after launch.
Stop forecasting blind. Your next step is a 45-minute conversation that costs nothing and could save hundreds of thousands in wasted effort and missed opportunity.
References & Sources
- Industry sales-forecasting benchmarks (Optifai Sales Ops Benchmark 2025–2026; multiple 2026 analyses) — typical accuracy ranges and horizon decay.
- Outreach and related revenue-intelligence research on forecasting challenges and AI-assisted accuracy improvements.
- Bain & Company B2B Growth Agenda findings on missed revenue targets.
- Australian Privacy Act 1988 (Cth) and OAIC guidance on data handling.
- ASX Listing Rules — continuous disclosure obligations.
- C9 internal delivery experience and client outcomes across custom BI and forecasting platforms.
- Supporting cost-of-inaccuracy analyses from Elasticflow, Trace Consultants and Australian retail/supply-chain studies.
About C9
C9 is an Australian custom software, apps, integration and database development firm specialising in unified data platforms, forecasting dashboards and business-intelligence solutions for mid-market and enterprise clients. Our blended hybrid model delivers offshore efficiency with Australian technical leadership and knowledge transfer.
Visit: https://www.c9.com.au
AI Transparency Notice:
This article was produced with the assistance of artificial intelligence tools, including content drafting, visual asset creation, and audio generation. All content has been reviewed and approved by C9 prior to publication.