Reading Time: 9 minutes | Last Updated: November 2025
Executive Summary
Australian mixed farming operations — especially wheat–barley–sheep enterprises — can generate millions in annual revenue yet still have no accurate understanding of which enterprise actually makes money. Research shows 68% of mixed farms cannot break down profitability by enterprise, meaning farmers make six‑figure decisions based on incomplete or misleading financial data.
Generic accounting platforms (Xero, MYOB, QuickBooks) were never built for multi‑enterprise farming. They mask loss‑making lines, misallocate machinery and labour costs, and ignore internal transactions between enterprises. The result is “enterprise profitability blindness” — a silent problem that can cost farmers up to $150,000 per year in avoidable losses or incorrect scaling decisions.
This guide explains why traditional accounting systems fail Australian mixed farms, the financial impact of that failure, and how custom Xero integration from C9 finally delivers real enterprise‑level visibility — backed by a rigorous discovery-first approach that protects farmers from “AI Cowboy” quick fixes.
The Problem
Mixed farming operations can see their overall profit — but not which enterprise (wheat, barley, sheep) is generating it. Off-the-shelf accounting tools blur machinery, labour, overheads, crop-year timing, and internal transfers.
The Solution
Custom Xero integration engineered specifically for Australian agriculture:
✅ Automated enterprise cost allocation
✅ Livestock & crop-year accounting
✅ Machinery hour allocation
✅ Internal transfer pricing
✅ Unified view of enterprise profitability in 30 seconds
What’s Next
Begin with a Discovery Phase to map enterprise structure, cost categories, livestock workflows, crop seasons, and financial reporting needs — preventing the expensive failures common with AI‑cowboy‑built integrations.
You run 2,000 hectares of wheat and barley while managing 1,500 merino sheep. Last financial year your farm generated $1.8 million in revenue. Your accountant tells you the operation made $285,000 profit.
But here’s the question that keeps successful farm owners awake at night:
“Which enterprise actually made you money?”
Was it the wheat? The barley? The sheep? Or are some enterprises quietly losing money while others carry the load?
If you can’t answer that question in 30 seconds with exact numbers, you’re not alone.
68% of Australian mixed farming operations cannot accurately break down profitability by enterprise. They know their total farm profit, but they have no idea which parts of their operation are genuinely profitable and which are subsidised losses.
This isn’t just an accounting curiosity. It’s the difference between:
- Making $285,000 profit versus $450,000 profit
- Expanding the wrong enterprise and losing $80,000
- Selling a profitable enterprise because you thought it was marginal
- Watching your neighbour’s operation thrive while yours stagnates
The problem isn’t your farming expertise. You know agriculture inside and out.
The problem is your accounting system was never designed for the complexity of mixed farming operations.
In this comprehensive guide, we’ll expose exactly why generic accounting software fails mixed farms, reveal the hidden cost of “enterprise profitability blindness”, and show you how custom Xero integration solves this challenge once and for all.
More importantly, we’ll show you the proper way to approach this transformation – through discovery-based development with knowledge transfer, not quick-fix “AI cowboy” solutions that create technical debt disasters.
Let’s start with the painful truth about what’s really happening in your farm accounts right now.
The Hidden Cost of Enterprise Profitability Blindness
The $150,000 Problem Hiding in Your Accounts
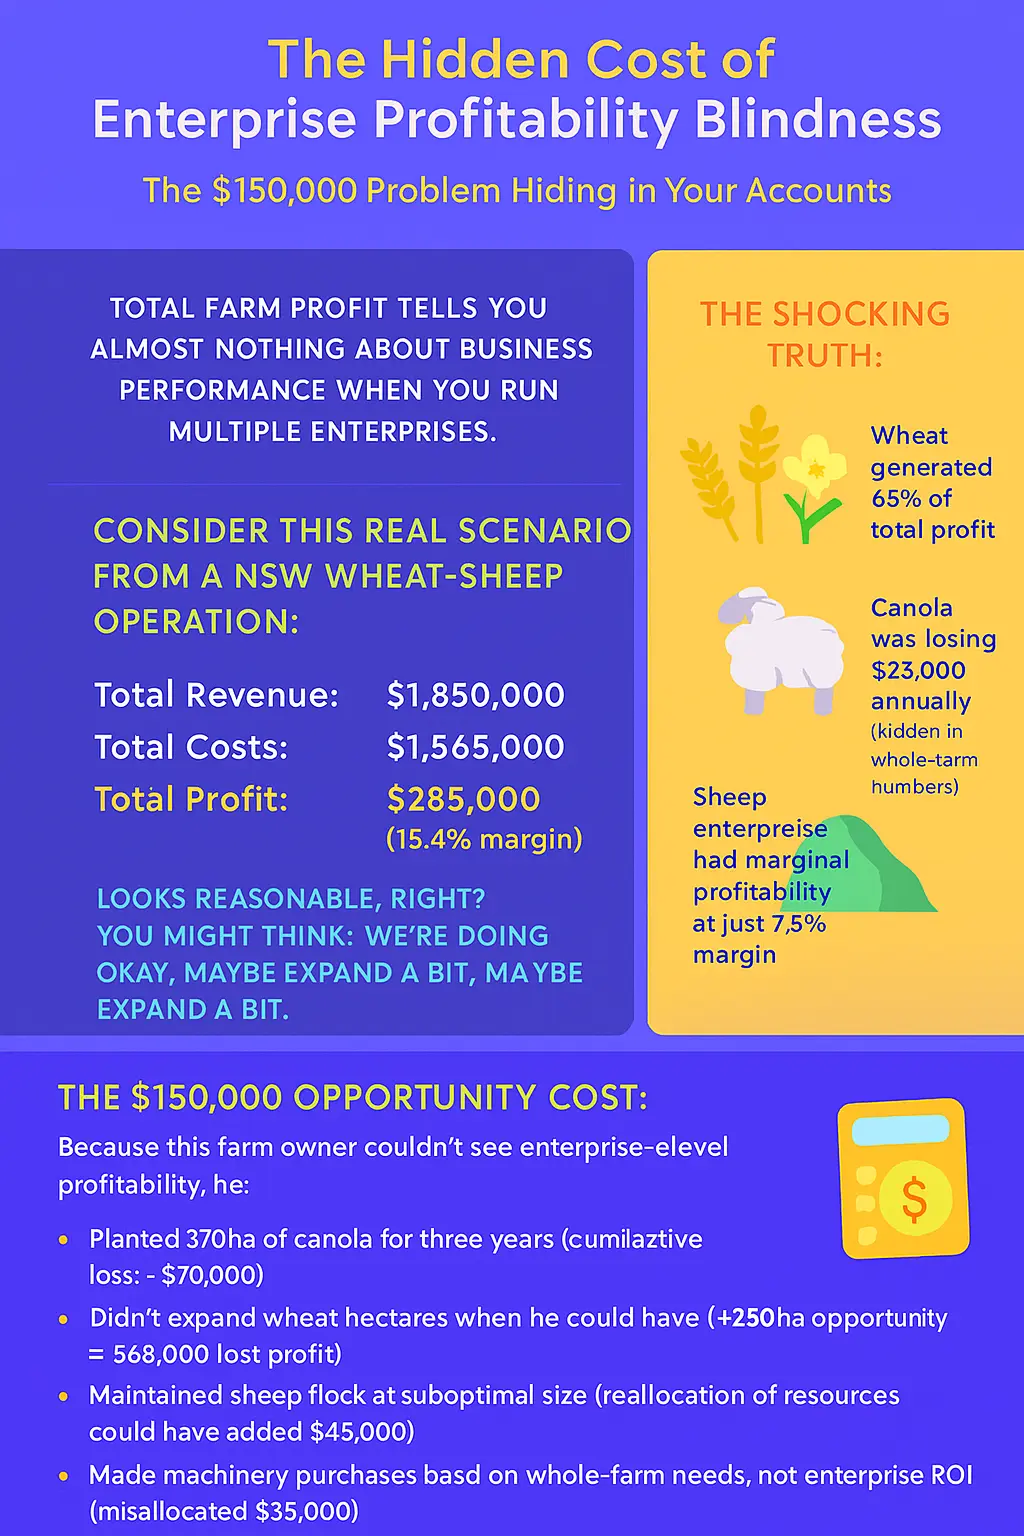
Total farm profit tells you almost nothing about business performance when you run multiple enterprises.
Consider this real scenario from a NSW wheat-sheep operation:
What the accountant reported:
- Total Revenue: $1,850,000
- Total Costs: $1,565,000
- Total Profit: $285,000 (15.4% margin)
Looks reasonable, right? You might think: “We’re doing okay. Maybe expand a bit, maintain course.”
What the numbers actually revealed after proper enterprise tracking:
| Enterprise |
Revenue |
Direct Costs |
Allocated Overhead |
Net Profit |
Margin |
| Wheat (850ha) |
$695,000 |
$425,000 |
$85,000 |
$185,000 |
26.6% |
| Barley (480ha) |
$385,000 |
$265,000 |
$55,000 |
$62,000 |
16.1% |
| Canola (370ha) |
$260,000 |
$215,000 |
$68,000 |
-$23,000 |
-8.8% |
| Merino Sheep |
$510,000 |
$398,000 |
$73,000 |
$39,000 |
7.6% |
| TOTAL |
$1,850,000 |
$1,303,000 |
$281,000 |
$285,000 |
15.4% |
The shocking truth:
- Wheat generated 65% of total profit despite being only 38% of revenue
- Canola was losing $23,000 annually (hidden in whole-farm numbers)
- Sheep enterprise had marginal profitability at just 7.6% margin
- The farm was essentially a wheat operation subsidising everything else
The $150,000 opportunity cost:
Because this farm owner couldn’t see enterprise-level profitability, he:
- Planted 370ha of canola for three years (cumulative loss: -$70,000)
- Didn’t expand wheat hectares when he could have (+250ha opportunity = $68,000 lost profit)
- Maintained sheep flock at suboptimal size (reallocation of resources could have added $45,000)
- Made machinery purchases based on whole-farm needs, not enterprise ROI (misallocated $35,000)
Total opportunity cost over 3 years: $218,000 in preventable losses and missed profits.
And this isn’t an extreme case. This is typical.
The Four Enterprise Tracking Failures That Cost You Money
Failure #1: Shared Machinery Cost Allocation
You own $850,000 worth of tractors, harvesters and implements. Your total annual machinery costs (fuel, maintenance, depreciation, insurance) are $125,000.
Generic accounting shows: Single line item “Machinery Expense: $125,000”
Reality:
- Your wheat operation uses machinery for 320 hours annually
- Your barley uses it for 180 hours
- Your sheep enterprise uses it for 95 hours (feeding, fencing, maintenance)
- Workshop overhead is mostly sheep-related
Without proper allocation, you think: “Machinery costs are spread evenly across all enterprises”
The truth: Your sheep enterprise actually consumes 42% of machinery overhead despite generating only 28% of revenue. This completely changes the profitability picture.
Failure #2: Labour Cost Invisibility
You employ two full-time workers plus yourself. Total annual labour cost: $185,000.
Generic accounting shows: Payroll: $185,000
Reality:
- 45% of labour hours go to cropping operations
- 38% go to livestock management
- 17% goes to administration and general overhead
But your current system has labour as one big bucket. You have no idea that your sheep enterprise actually requires $70,300 in labour (38% of $185,000) while generating only $39,000 net profit in the earlier example.
That’s a labour cost ratio of 180% — completely unsustainable, but invisible in your current accounting.
Failure #3: Overhead Allocation Guesswork
Property rates, insurance, utilities, professional fees: $78,000 annually.
How do you allocate this fairly across enterprises?
Most farms either:
- By revenue (punishes high-revenue, low-margin enterprises)
- By hectares (ignores that livestock is more labour/infrastructure intensive)
- Equally (unfair to smaller enterprises)
- By gut feel (not based on actual resource consumption)
None of these approaches reflect actual cost causation.
Failure #4: Internal Transactions Are Ignored
You grow 450 tonnes of hay on 120 hectares. You feed 280 tonnes to your own sheep. You sell 170 tonnes for $280/tonne.
Generic accounting shows:
- Hay sales revenue: $47,600
- Cropping costs on those 120ha: $42,000
- Sheep feed purchase: $0 (it’s your own hay)
This creates three problems:
- Your cropping enterprise is understated: It actually produced 450 tonnes worth $126,000 at market value, not just the $47,600 you sold externally. True gross margin is $84,000, not $5,600.
- Your sheep enterprise profitability is overstated: It consumed $78,400 worth of hay (280 tonnes × $280/tonne) but shows $0 feed cost. This makes sheep look profitable when they might not be.
- You can’t make rational decisions: Should you buy hay and sell your paddock hay externally? Should you expand the sheep flock? You literally cannot answer these questions without proper internal transfer pricing.
The Consequences: Making Million-Dollar Decisions Based on Incomplete Data
Here’s what enterprise profitability blindness costs you:
Strategic Errors:
- Expanding enterprises that are actually losing money
- Contracting or selling profitable enterprises you thought were marginal
- Misallocating capital investment across enterprises
- Making machinery purchases based on whole-farm needs, not enterprise ROI
Operational Inefficiencies:
- Can’t identify which input costs have highest impact by enterprise
- Unable to benchmark your enterprise performance against industry standards
- Can’t respond quickly to market changes (e.g. should you forward-sell wheat based on actual crop profitability?)
Financial Management Problems:
- Inaccurate cash flow forecasting (don’t know timing of enterprise-specific income/costs)
- Poor working capital allocation
- Suboptimal debt structure (borrowing against wrong assets/enterprises)
- Can’t demonstrate enterprise profitability to banks for asset financing
Succession and Exit Challenges:
- Can’t value individual enterprises for partial sale or partnership
- Next generation can’t make informed decisions about which enterprises to focus on
- Lower farm valuation (sophisticated buyers want enterprise-level data)
- Harder to attract investors or partners
Compliance and Tax Risks:
- ATO increasingly scrutinises farm deductions — enterprise-level tracking provides audit protection
- Difficult to justify business purpose for certain expenses
- Missing depreciation optimization opportunities
- Cannot demonstrate business purpose for borderline expenses
The Emotional Toll
Beyond the financial impact, there’s the stress of not knowing:
“I work 70-hour weeks managing this farm. I make decisions that affect hundreds of thousands of dollars. But I have no idea if I’m making the right choices about which enterprises to grow or cut. I’m flying blind, and it keeps me up at night.”
That’s the pain point. That’s what 68% of mixed farming operations experience every single day.
But it gets in worse when you understand why your current system can’t solve this problem.
Why Generic Accounting Software Fails Mixed Farming Operations
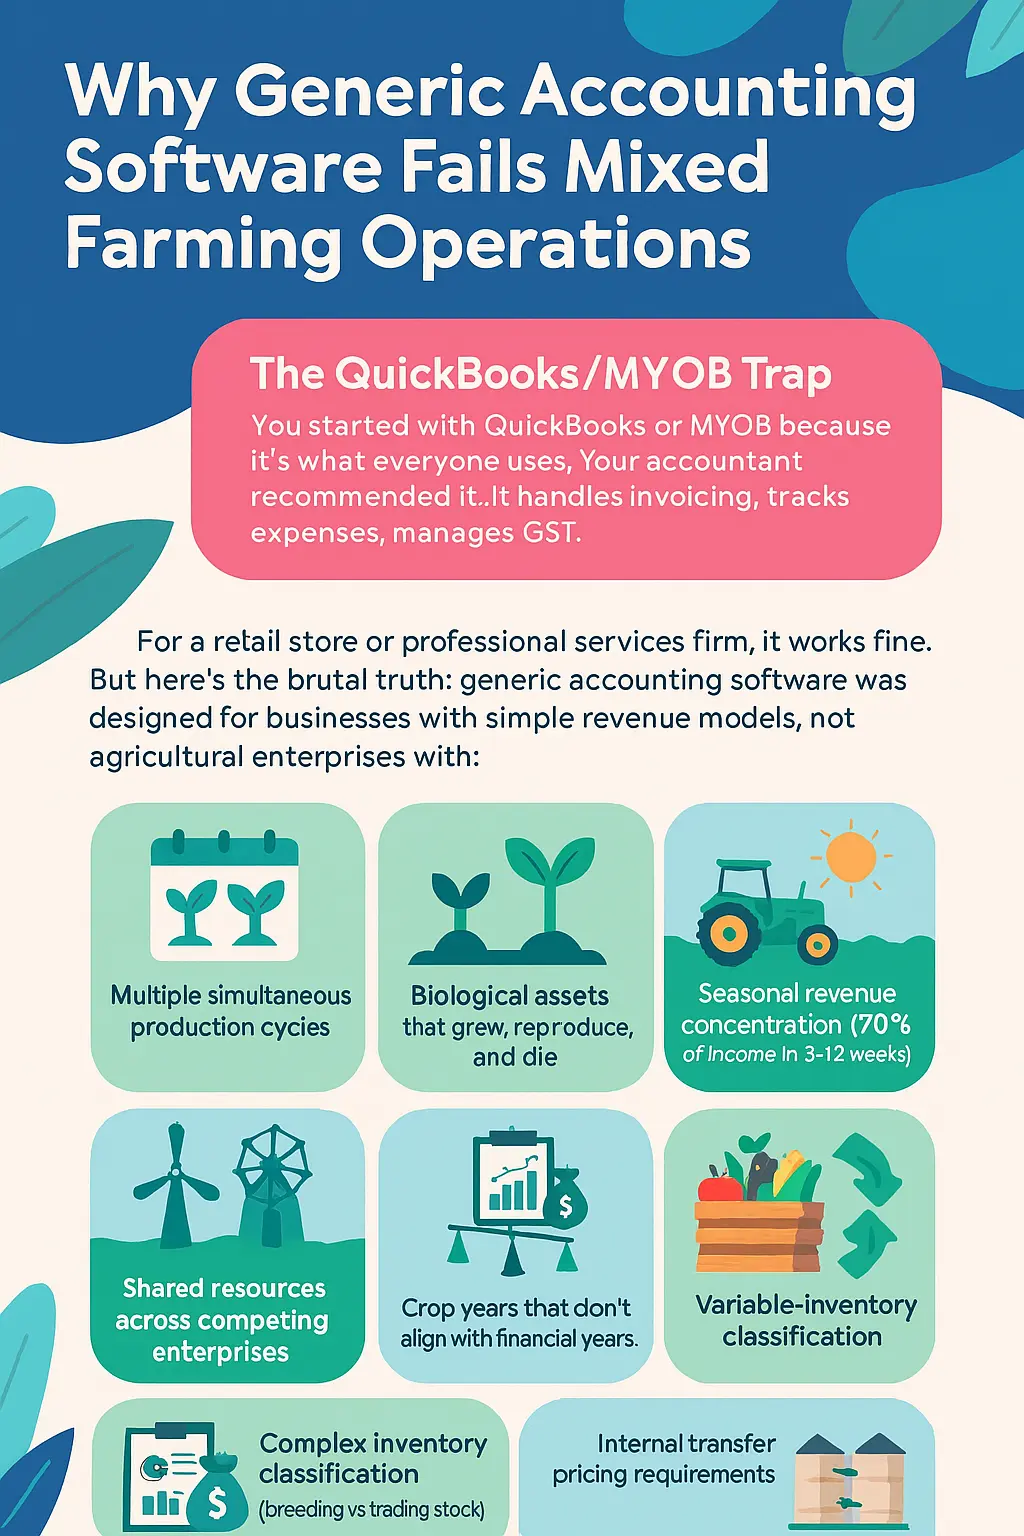
The QuickBooks/MYOB Trap
You started with QuickBooks or MYOB because it’s what everyone uses. Your accountant recommended it. It handles invoicing, tracks expenses, manages GST.
For a retail store or professional services firm, it works fine.
But here’s the brutal truth: Generic accounting software was designed for businesses with simple revenue models, not agricultural enterprises with:
- Multiple simultaneous production cycles
- Biological assets that grow, reproduce, and die
- Seasonal revenue concentration (70% of income in 8-12 weeks)
- Shared resources across competing enterprises
- Crop years that don’t align with financial years
- Variable-weight commodity products
- Complex inventory classification (breeding vs trading stock)
- Internal transfer pricing requirements
The Five Critical Gaps That Cripple Mixed Farm Accounting
Gap #1: Single-Entity Architecture
QuickBooks was built on a fundamental assumption: you have ONE business.
For a café, this works. You sell coffee. All costs go into “Cost of Goods Sold”. All revenue is “Sales Revenue”.
But your farm isn’t one business — it’s 3-5 businesses operating under one entity:
- Wheat enterprise (spring-summer crop cycle)
- Barley enterprise (winter crop cycle)
- Canola enterprise (different input costs, different markets)
- Sheep enterprise (continuous operation, different cost structure)
- Custom work enterprise (seasonal service revenue)
Generic accounting software has no concept of “enterprises” as separate profit centres. You can use:
- Classes (but they’re clunky, not designed for agriculture, and limited in reporting)
- Locations (but your enterprises aren’t location-based — wheat and sheep use the same paddocks)
- Custom fields (but then you lose standard reporting functionality)
- Job costing (but crops aren’t “jobs” — they’re production cycles with shared resources)
The result: Most farm bookkeepers give up and just record everything at the whole-farm level. Enterprise profitability becomes impossible to track.
Gap #2: Calendar Year Prison
Your wheat operation timeline:
- May 2024: Purchase seed, fertilizer, chemicals
- June-July 2024: Planting and initial inputs
- August-October 2024: In-crop applications and fuel costs
- November 2024: Pre-harvest costs
- January 2025: Harvest (labour, machinery, fuel spike)
- March 2025: Final grain sales (storage costs, freight)
This single crop spans THREE financial years:
- FY 2023-24: Pre-planting costs
- FY 2024-25: Main production and harvest
- FY 2025-26: Final sales and closeout
QuickBooks forces you into calendar-year or financial-year reporting. It has no concept of “crop year” profitability.
Your accountant can manually calculate crop-year profit at tax time, but that means:
- You can’t see in-season crop profitability
- You can’t make tactical decisions mid-season (sell now or hold?)
- You can’t compare this year’s wheat performance to last year’s until 6-8 months after harvest
- Your cash accounting shows profit in the wrong periods
This isn’t just inconvenient — it prevents timely business decisions.
Gap #3: Livestock Inventory Nightmare
You have 1,500 merino sheep. They’re categorised as:
- Breeding ewes (capital assets for tax purposes, breeding stock)
- Ewe lambs (replacement stock, different valuation)
- Wether lambs (trading stock for sale)
- Rams (capital assets, different depreciation treatment)
Australian tax law requires:
- Breeding stock valued at cost or market value, treated as depreciating assets
- Trading stock valued at cost, market value, or replacement value (your choice)
- Different GST treatment for breeding vs trading stock sales
- Age-based classification that changes annually (ewe lamb becomes breeding ewe at 12 months)
Your sheep also:
- Give birth (suddenly you have 600 new lambs — how do you value them?)
- Die (mortality removes inventory — how do you track that by class?)
- Get reclassified (lambs become ewes, ewes become cull stock)
- Fluctuate in weight (market value changes weekly)
Generic software treats all sheep as one inventory item. You end up with:
- Manual spreadsheets outside the system
- Inaccurate valuations for tax purposes
- No ability to track natural increase properly
- GST errors waiting to happen
Gap #4: No Native Enterprise-Level Reporting
Even if you force classes/locations to work, the reporting is terrible:
- Profit & Loss by class shows direct costs only — overhead allocation is manual
- Balance sheet doesn’t split by enterprise
- No enterprise-specific KPIs (gross margin per hectare, $/DSE, etc.)
- Can’t produce enterprise budgets vs actuals easily
Gap #5: Integration Limitations
Your farm uses multiple systems:
- Payroll (separate software)
- Grain trading platform
- Livestock trading platform (NLIS, Integrity Systems)
- Weather/rainfall recording
- Machinery logbooks
- Chemical application records
Generic software has limited API capabilities. Data stays siloed.
Xero is different.
Xero was built from the ground up as a cloud-native, API-first platform. It was designed for integration and customisation — exactly what mixed farming needs.
But here’s the crucial point: Standard Xero by itself still doesn’t solve enterprise tracking.
You need custom Xero integration built specifically for Australian mixed farming operations.
How Custom Xero Integration Solves Enterprise Profitability Blindness
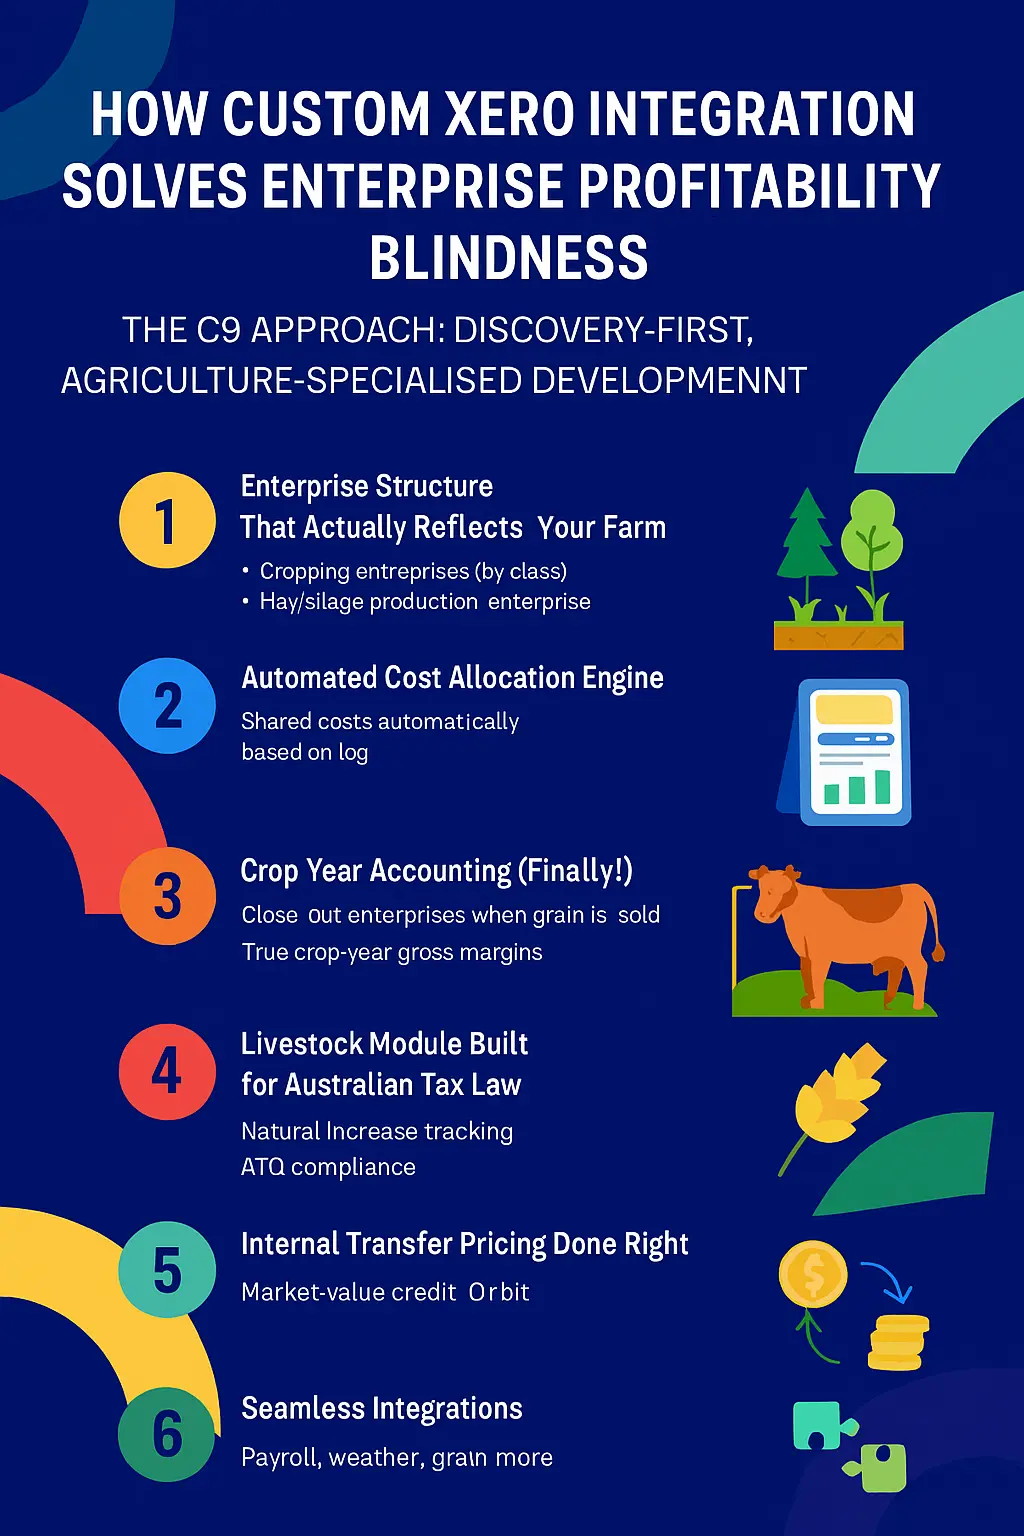
The C9 Approach: Discovery-First, Agriculture-Specialised Development
At C9, we’ve built custom Xero integrations for dozens of Australian mixed farming operations — from 1,500ha cropping/livestock enterprises to 25,000ha corporate farms.
We don’t sell “farm management software”. We build tailored extensions to Xero that make it work like the agriculture-specific system you always wished existed.
Here’s exactly how it works:
1. Enterprise Structure That Actually Reflects Your Farm
We create a custom enterprise hierarchy in X Profess that mirrors your real operation:
- Cropping enterprises (by crop type and year)
- Livestock enterprises (by class — breeding ewes, trading lambs, etc.)
- Custom work enterprise
- Hay/silage production enterprise
Each enterprise becomes a true profit centre with:
- Its own chart of accounts mapping
- Automatic cost allocation rules
- Enterprise-specific tracking categories
2. Automated Cost Allocation Engine
No more manual spreadsheets. Our integration automatically allocates shared costs based on actual usage:
Machinery costs → allocated by machinery hours logged (integrated with your logbook app or manual entry) Labour costs → allocated by digital timesheets or fixed percentages reviewed annually Overhead costs → allocated by your chosen drivers (hectares, revenue, DSE, hybrid models) Land costs → allocated by paddock mapping (yes, we can integrate with your farm mapping software)
3. Crop Year Accounting (Finally!)
We create “crop year” tracking that spans financial years:
- Start a new wheat enterprise for “Wheat 2025”
- All costs automatically flow to that enterprise regardless of financial year
- Close out the enterprise when final grain is sold (could be 18 months after planting)
- Instantly see true crop-year gross margins
4. Livestock Module Built for Australian Tax Law
Proper natural increase tracking:
- Lambs born → automatically added to inventory at nominated value
- Deaths/culls → automatically removed
- Reclassification → ewe lambs become breeding ewes at marking or chosen age
- Different valuation methods by class
- Full ATO compliance reporting
5. Internal Transfer Pricing Done Right
When you feed your own hay to sheep:
- Hay enterprise gets market-value credit ($280/tonne)
- Sheep enterprise gets market-value debit ($280/tonne)
- No GST implications (internal transfer)
- Both enterprises show true profitability
6. Seamless Integrations
We connect Xero to your existing tools:
- Payroll systems (KeyPay, Xero Payroll, etc.)
- Grain trading platforms
- Livestock trading (NLIS transfers automated)
- Weather stations
- Machinery telematics
- Bank feeds with smart rules
Real Results from Australian Farms
Case Study: 4,200ha NSW Mixed Farm
- Before: Couldn’t separate cropping vs livestock profitability
- After custom integration:
- Discovered livestock enterprise was losing $48,000 annually (previously hidden)
- Reallocated 380ha from marginal pasture to cropping → +$92,000 profit
- Reduced sheep flock by 38% while increasing total farm profit by 28%
- Bank accepted enterprise-level reports → secured $1.2M machinery finance at better rates
Case Study: 8,100ha WA Operation
- Multiple crop types + sheep
- Implemented full enterprise tracking + internal transfer pricing
- Identified canola enterprise had been losing money for 4 years
- Switched those hectares to wheat → immediate $180,000 profit improvement
- Succession planning now possible with clear enterprise valuations
Why Off-the-Shelf “Farm Software” Isn’t the Answer
You’ve probably looked at AgriMaster, Figured, FarmFlo, etc.
They’re better than QuickBooks for some things, but:
- Force you to duplicate data entry (everything in Xero AND their system)
- Create data silos
- Cost $5,000–$15,000 per year
- Still don’t integrate perfectly with your accountant’s Xero file
Custom Xero integration keeps everything in one source of truth — your existing Xero file that your accountant already uses.
The Proper Way to Approach Custom Xero Integration
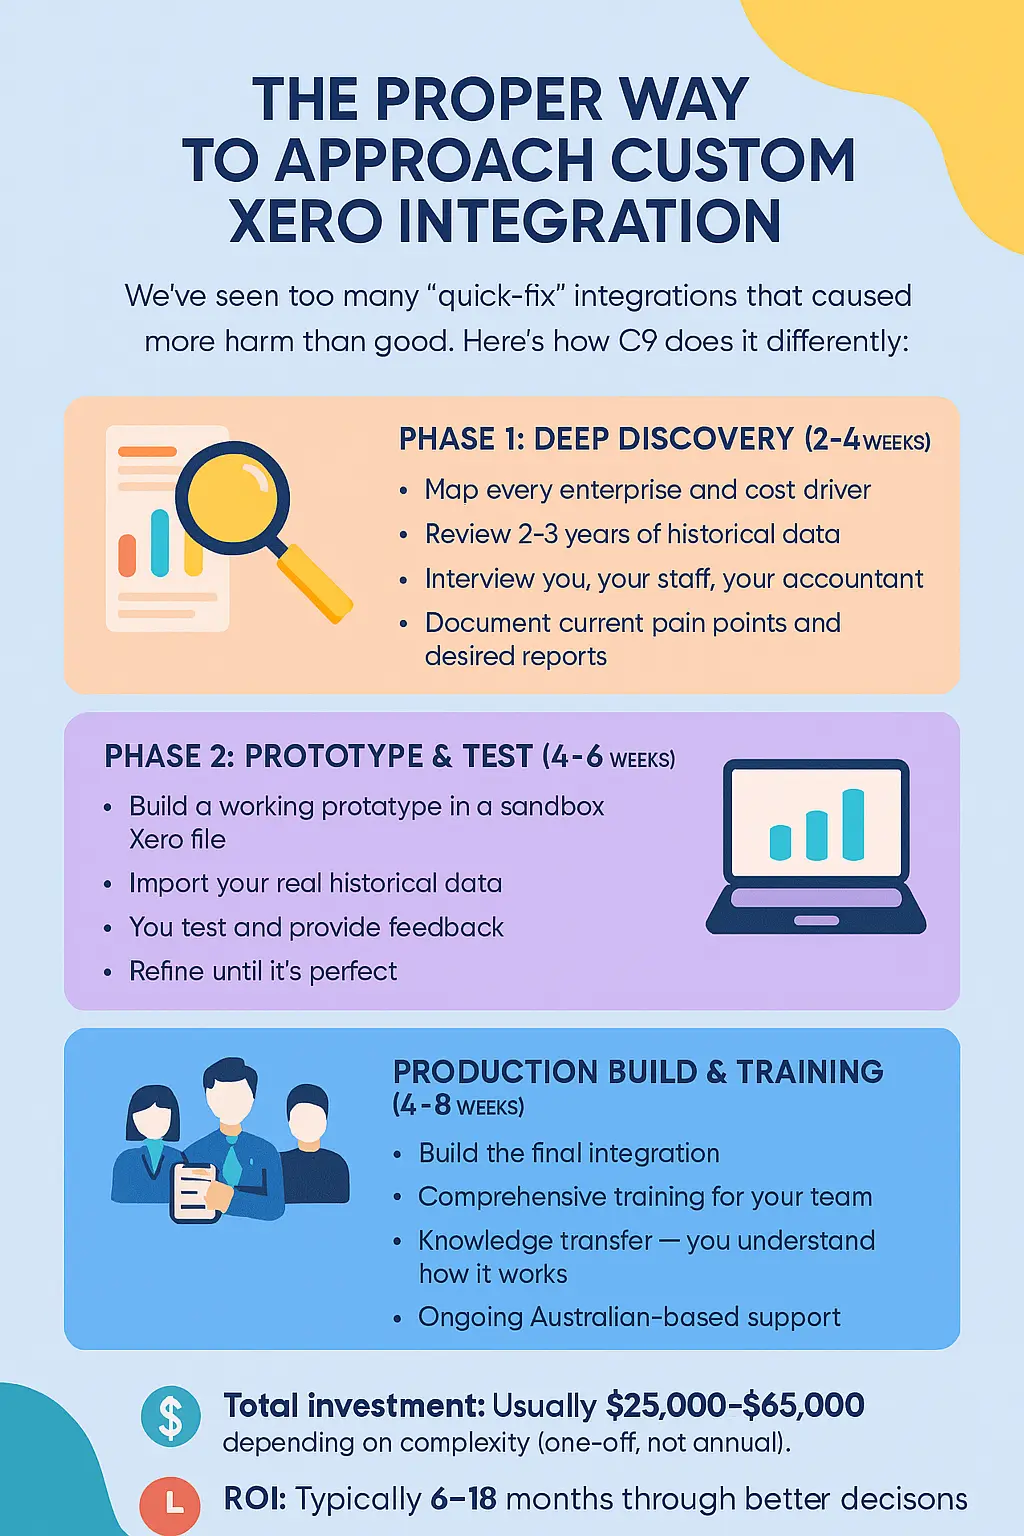
We’ve seen too many “quick-fix” integrations that caused more harm than good.
Here’s how C9 does it differently:
Phase 1: Deep Discovery (2–4 weeks)
- Map every enterprise and cost driver
- Review 2–3 years of historical data
- Interview you, your staff, your accountant
- Document current pain points and desired reports
Phase 2: Prototype & Test (4–6 weeks)
- Build a working prototype in a sandbox Xero file
- Import your real historical data
- You test and provide feedback
- Refine until it’s perfect
Phase 3: Production Build & Training (4–8 weeks)
- Build the final integration
- Comprehensive training for your team
- Knowledge transfer — you understand how it works
- Ongoing Australian-based support
Total investment: Usually $25,000–$65,000 depending on complexity (one-off, not annual).
ROI: Typically 6–18 months through better decisions.
Ready to Finally Know Which Enterprises Are Making You Money?
You’ve spent decades mastering agriculture. Isn’t it time your accounting system caught up?
At C9, we’ve helped Australian mixed farming operations transform from “flying blind” to having complete enterprise visibility — all within their existing Xero environment.
Book a free 30-minute discovery call with our agricultural integration specialists.
We’ll review your current setup and show you exactly what’s possible.
Book Your Free Discovery Call Today →
Don’t let another season pass making decisions based on incomplete data.
The wheat enterprise that’s actually carrying your farm deserves to be recognised. The marginal enterprise that’s quietly bleeding money deserves to be fixed or phased out.
You deserve to sleep better at night knowing exactly which parts of your operation are driving success.
Let’s build the system that finally gives you that clarity.