Executive Summary:
Australian businesses waste an average of $200,000-$500,000 annually on fragmented analytics infrastructure—juggling separate tools for data warehousing, ETL processes, business intelligence dashboards, and machine learning whilst paying premium prices for siloed expertise. Microsoft Fabric with Power BI eliminates this fragmentation by unifying your entire analytics ecosystem into a single platform, reducing infrastructure costs by 30-40% and accelerating insights from weeks to days. However, implementation without proper discovery and expert guidance leads to project failures that waste six figures and destroy stakeholder confidence. This comprehensive guide reveals why strategic Fabric implementation with proven Australian expertise delivers transformational ROI—whilst exposing the dangerous pitfalls of "AI Cowboys" and cheap vibes coding that leave businesses with unmaintainable technical debt.
What's Next?
If your organisation struggles with slow, expensive, fragmented analytics—or you're evaluating Fabric migration—the discovery phase isn't optional overhead. It's the difference between success and disaster. C9's blended hybrid team of onshore and offshore specialists delivers enterprise-grade Fabric implementations with comprehensive knowledge transfer, ensuring your investment pays dividends for years.
Table of Contents
- The Analytics Crisis Facing Australian Businesses
- Microsoft Fabric: Australia's Analytics Solution
- Why Discovery Calls Save Six Figures
- The AI Cowboy Epidemic: Cheap Builds, Expensive Consequences
- C9's Competitive Advantage in the Australian Market
- Staff Augmentation: Flexible Expertise Without Hiring Risk
- Pricing Truth: Why Indicative Quotes Destroy Projects
- Taking Action: Your Path to Analytics Excellence
The Analytics Crisis Facing Australian Businesses
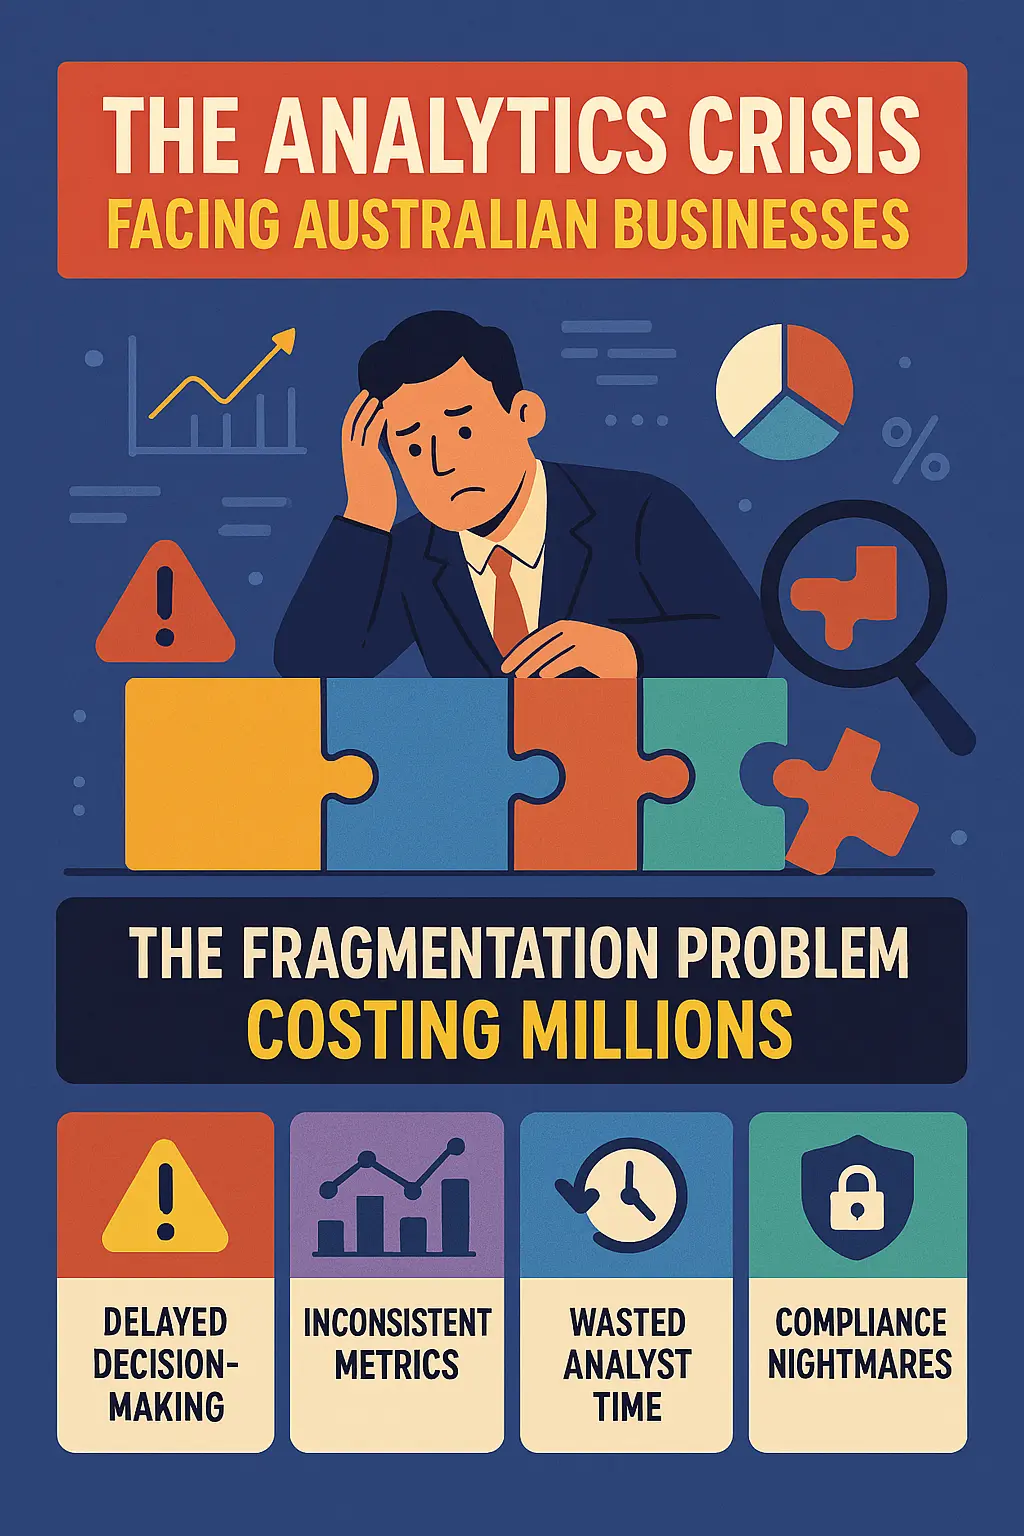
The Fragmentation Problem Costing Millions
Every Australian business executive knows this painful reality: your organisation's data lives everywhere except where you need it. Finance operates in MYOB or Xero. Sales teams work in Salesforce or Microsoft Dynamics. Operations manages inventory in proprietary ERP systems. Marketing tracks campaigns across Google Analytics, social platforms, and email tools. Customer service logs tickets in Zendesk or ServiceNow.
Each system provides partial visibility. None offers complete answers.
According to recent industry analysis, mid-to-large Australian organisations typically operate 8-12 separate analytics and data management tools, each requiring:
- Individual licensing fees ($15,000-$75,000 per tool annually)
- Specialised expertise for implementation and maintenance
- Custom integration development to connect with other systems
- Separate governance and security configurations
- Redundant data storage creating compliance risks
The hidden cost? Beyond direct software expenses, fragmented analytics creates:
Delayed Decision-Making: Executives wait days or weeks for reports that manually combine data from multiple sources. Competitors using integrated platforms make real-time decisions and seize opportunities first.
Inconsistent Metrics: Marketing's "customer lifetime value" calculation differs from Finance's definition. Sales pipeline forecasts don't align with operational capacity planning. Management meetings devolve into debates about which numbers are correct rather than strategic discussions.
Wasted Analyst Time: Business analysts spend 60-80% of their time wrangling data—extracting from various systems, cleaning inconsistencies, manually merging spreadsheets—leaving minimal capacity for actual analysis and insight generation.
Compliance Nightmares: Australian Privacy Principles require organisations to track data lineage, manage consent, and ensure security. Fragmented systems multiply compliance complexity exponentially, creating audit vulnerabilities and potential regulatory penalties.
Failed Projects: According to Gartner research, 87% of analytics initiatives fail to move beyond proof-of-concept stages. The primary culprit? Organisational fragmentation preventing the data integration necessary for transformational insights.
Why the Problem Is Accelerating
The analytics fragmentation crisis worsens annually due to converging factors:
Data Volume Explosion: Australian businesses generate 40-60% more data yearly. Legacy systems buckle under increasing loads. Query performance degrades. Users abandon slow dashboards, reverting to manual spreadsheet analysis.
Cloud Migration Complexity: Moving from on-premises to cloud infrastructure creates hybrid environments where data spans both worlds. Integration costs spiral as organisations attempt to bridge on-premises databases with cloud applications whilst maintaining security and performance.
Skills Shortage Crisis: Australia faces severe analytics talent scarcity. Job postings for Power BI developers remain unfilled for 6+ months. Experienced specialists command salaries exceeding $120,000-$140,000 annually. Recruitment fees add another $24,000-$35,000. Once hired, these professionals often leave within 18 months, taking institutional knowledge with them.
Regulatory Pressure: Australian Privacy Principles, industry-specific regulations, and data sovereignty requirements multiply governance complexity. Each disconnected system needs separate policies, security frameworks, and audit trails.
Competitive Disadvantage: Whilst your team generates last week's reports, competitors leveraging modern unified platforms optimise operations in real-time, personalise customer experiences dynamically, and identify revenue opportunities you discover too late—if at all.
Microsoft Fabric: Australia's Analytics Solution
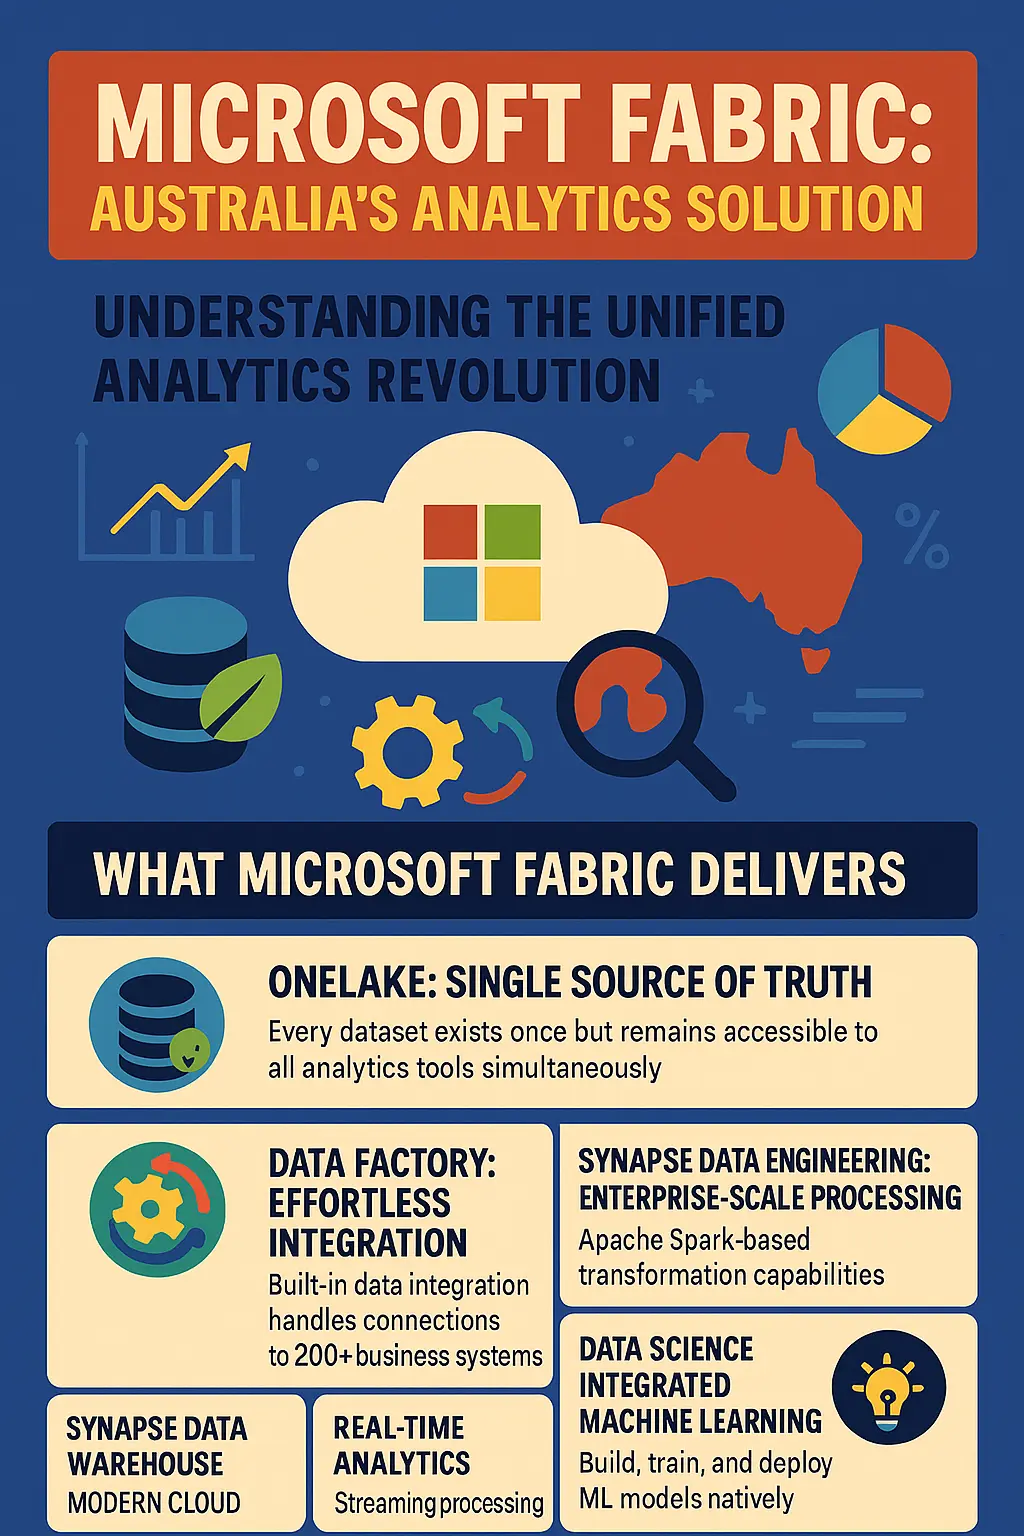
Understanding the Unified Analytics Revolution
Microsoft Fabric represents a fundamental reimagining of analytics infrastructure—consolidating capabilities previously requiring multiple disparate tools into one seamless, integrated platform built on a unified data lake called OneLake.
What Microsoft Fabric Delivers
OneLake: Single Source of Truth
Every dataset exists once but remains accessible to all analytics tools simultaneously. Data duplication disappears. Storage costs plummet. Governance simplifies dramatically.
Data Factory: Effortless Integration
Built-in data integration handles connections to 200+ business systems including Salesforce, MYOB, Xero, SAP, Oracle, and legacy databases through low-code/no-code interfaces replacing expensive specialised ETL tools.
Synapse Data Engineering: Enterprise-Scale Processing
Apache Spark-based transformation capabilities handle petabyte-scale workloads, preparing raw data for analytics consumption through familiar notebook-based development environments.
Synapse Data Warehouse: Modern Cloud Storage
SQL-based analytics at enterprise scale with separated storage and compute, enabling cost optimisation whilst maintaining familiar SQL interfaces for business analysts.
Data Science: Integrated Machine Learning
Build, train, and deploy ML models natively within Fabric. Predictions become accessible directly in Power BI dashboards without complex integration projects.
Real-Time Analytics: Streaming Processing
Handle IoT sensors, operational systems, and event streams with millisecond latency through KQL databases optimised for time-series analysis.
Power BI: World-Class Visualisation
The familiar Power BI interface gains supercharged performance through DirectLake mode—delivering import-mode speed with DirectQuery freshness.
Solving Australian Business Challenges
Challenge: Data scattered across 8-12 disconnected systems
Fabric Solution: OneLake consolidates all data into unified storage accessible by every analytics component
Challenge: $50,000-$200,000 annual ETL tool licensing
Fabric Solution: Built-in Data Factory eliminates separate ETL infrastructure costs
Challenge: Slow query performance frustrating users
Fabric Solution: DirectLake mode queries data at import-mode speeds whilst maintaining real-time freshness
Challenge: Data engineers, analysts, and scientists working in isolation
Fabric Solution: Shared workspace enabling seamless collaboration across all analytics roles
Challenge: Governance requiring separate frameworks per system
Fabric Solution: Unified governance with consistent security policies across all workloads
Challenge: Escalating infrastructure costs as data volumes grow
Fabric Solution: Capacity-based licensing—one payment covers all analytics capabilities instead of separate tool subscriptions
Australian Business Impact: Real Results
Manufacturing - Melbourne: A mid-sized manufacturer consolidated five separate analytics systems into Fabric, reducing infrastructure costs by 42% whilst implementing predictive maintenance decreasing unplanned downtime by 35%. The unified platform enabled cross-functional visibility previously impossible, improving production planning efficiency by 28%.
Retail - National Chain: A major retailer integrated point-of-sale systems, e-commerce platforms, inventory management, and customer data through Fabric. Results included 28% improvement in inventory turnover, 40% reduction in stock-outs, and $2.3M annual savings from optimised purchasing and reduced waste.
Financial Services - Sydney: A financial institution migrated from legacy BI infrastructure to Fabric, accelerating regulatory reporting from two weeks to two days whilst improving data accuracy and reducing compliance risk. The organisation eliminated $180,000 in annual licensing fees for replaced tools.
Healthcare - Adelaide: A healthcare provider unified patient records, billing systems, and operational metrics in Fabric, enhancing patient outcomes through better care coordination whilst reducing IT overhead by $165,000 annually and improving staff satisfaction with data accessibility.
Why Discovery Calls Save Six Figures (And Projects)
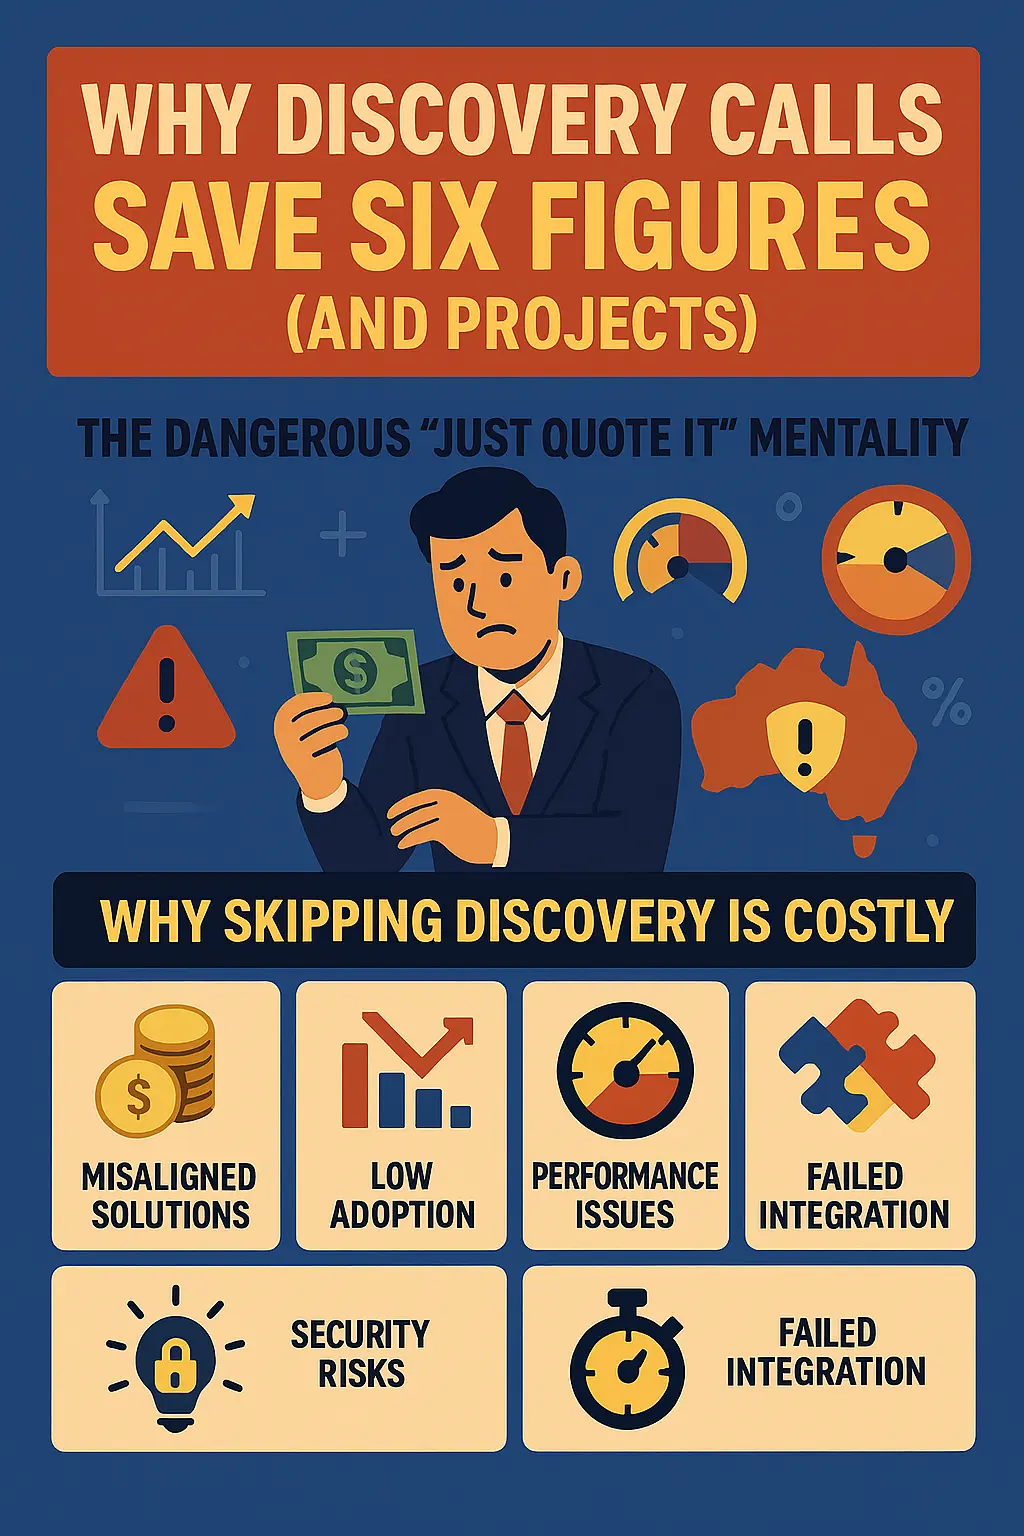
The Dangerous "Just Quote It" Mentality
Australian executives often view discovery as unnecessary overhead: "We know what we need—just give us a price and start building." This mindset is the #1 killer of analytics projects, leading to:
- Six-figure implementations solving the wrong problems
- Dashboards nobody uses because they don't reflect actual workflows
- Performance disasters discovered post-launch requiring expensive rework
- Security vulnerabilities exposing sensitive data to compliance risks
- Integration failures from misunderstood data structures
- Budget overruns of 100-300% destroying stakeholder confidence
The brutal reality: Skipping discovery creates far more pain than the 2-3 week investment requires.
What Proper Discovery Prevents
Disaster #1: The $180,000 Dashboard Nobody Uses
A Brisbane logistics company engaged a "fast and cheap" developer to build fleet tracking dashboards. No discovery—just a quick requirements email and immediate development start. Eight weeks and $45,000 later, the system launched.
The problems discovered post-launch:
- Drivers couldn't access mobile dashboards during deliveries (not optimised for phones)
- Managers needed real-time updates but system refreshed only nightly
- Security model showed all drivers' locations to everyone (privacy violation)
- Performance degraded catastrophically with full year of historical data
- Integration broke whenever GPS vendor updated their API
Result: Complete rebuild required. Total waste: $45,000 initial build + $67,000 proper rebuild + $68,000 in operational disruption = $180,000 disaster. Proper discovery would have cost $18,000 and prevented every issue.
Disaster #2: The "Simple" Integration That Wasn't
A Melbourne retailer wanted to "simply connect our e-commerce platform to Power BI." They hired a freelancer who quoted $8,000 based on e-commerce platform documentation. No discovery.
Reality uncovered mid-project:
- E-commerce platform's API rate limits prevented required data volume
- Historical order data stored in different structure than current orders
- Product categorisation changed three times over past two years
- Customer data had duplicate records requiring deduplication logic
- Payment processor stored transaction details separately requiring additional integration
Result: Project stalled at 60% completion. Freelancer disappeared. Total cost including incomplete work, internal team time wasted, and proper rebuild: $47,000. Discovery investment would have been $12,000 and revealed complexity before commitment.
How C9's Discovery Process Works
Week 1: Stakeholder Alignment and Requirements
Executive Interviews: Understanding business objectives, pain points, success criteria, and political dynamics affecting project support.
Department Head Consultations: Discovering how different groups use data, what decisions require insights, and existing workflow integration points.
End User Workshops: Learning actual daily tasks, current tool frustrations, and specific information needs driving their roles.
Documentation Review: Examining existing systems, previous project attempts, data dictionaries, and technical architecture.
Week 2: Technical Assessment and Architecture
Data Source Audit: Cataloguing every system containing relevant data, evaluating quality, accessibility, and integration complexity.
Infrastructure Review: Understanding current hosting environments, network configurations, security policies, and cloud migration status.
Performance Analysis: Assessing data volumes, query patterns, user concurrency requirements, and scalability needs.
Security and Compliance Evaluation: Reviewing Australian Privacy Principles adherence, industry regulations, data sovereignty requirements, and governance frameworks.
Week 3: Solution Design and Proposal
Architecture Documentation: Detailed technical design showing data flows, integration patterns, security models, and deployment approach.
Phased Roadmap: Breaking implementation into stages delivering early ROI whilst managing risk and enabling iterative learning.
Accurate Pricing: Hour-level cost estimation based on actual requirements, not vague guesses rounded to nearest month.
Risk Assessment: Identifying potential obstacles, technical challenges, and mitigation strategies ensuring proactive management.
Success Metrics: Defining measurable outcomes, acceptance criteria, and KPIs proving project value.
Discovery Investment ROI
Typical Discovery Cost: $12,000-$25,000 (2-3 weeks)
Typical Savings Delivered:
- Preventing scope creep: $30,000-$80,000 (through accurate initial scoping)
- Avoiding technical dead-ends: $20,000-$50,000 (choosing optimal architecture upfront)
- Accurate resource planning: $15,000-$40,000 (eliminating costly delays and rework)
- Phasing for early ROI: $25,000-$100,000 (operational savings funding later stages)
Total Savings: $90,000-$270,000 on typical projects
ROI: 360-1,080% return on discovery investment
The AI Cowboy Epidemic: Cheap Builds, Expensive Consequences
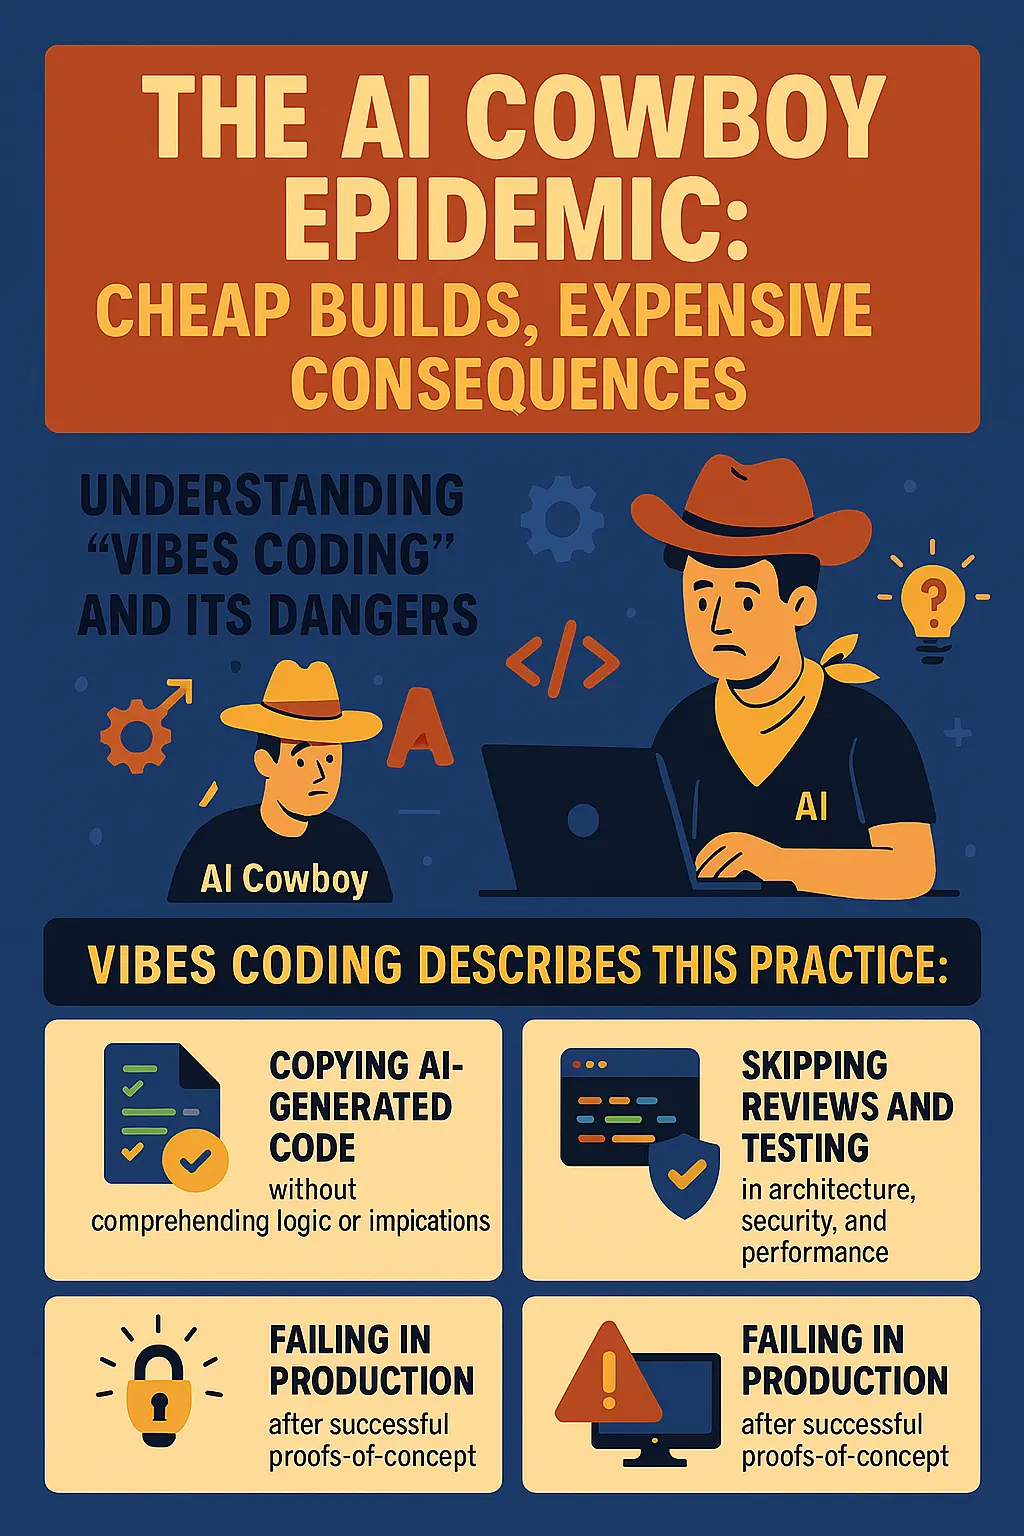
Understanding "Vibes Coding" and Its Dangers
The proliferation of AI code generation tools—ChatGPT, GitHub Copilot, and countless "AI app builders"—has spawned a dangerous new developer category: AI Cowboys generating code without understanding what they're building.
Vibes coding describes this practice:
- Copying AI-generated code without comprehending logic or implications
- Stitching together snippets that "seem to work" in basic demos
- Skipping architecture planning, security reviews, and performance testing
- Lacking foundational knowledge to debug when problems arise
- Delivering solutions working in demos but failing in production
Think of it as using Google Translate to perform surgery—the tool isn't problematic, but expertise-free usage creates disasters.
The Tempting AI Cowboy Pitch
Why do businesses engage AI Cowboys despite risks?
Attractive Promises:
- "Build Power BI dashboards in days, not months!"
- "$50/hour rates versus $150+ from established firms"
- "AI-powered development for 10x faster delivery"
- "Why pay expensive consultants when AI does the work?"
For cost-conscious Australian businesses—especially smaller organisations or those burned by overpriced enterprise consultants—these propositions seem compelling.
Where Vibes Coding Appears Fine (But Isn't)
Scenario 1: The Demo That Deceives
An AI Cowboy delivers professional-looking dashboards working perfectly... with the 100-row sample dataset used during testing. Deploy to production with 10 million rows? System grinds to a halt with 5-minute load times.
Why? AI-generated DAX uses row context iteration instead of efficient aggregation. Real Power BI experts optimise data models and calculations from inception, not after performance disasters emerge.
Cost Impact: "Cheap" $15,000 initial build requires $23,000 performance remediation plus business disruption during unusable period.
Scenario 2: The Integration Time Bomb
The freelancer successfully connects your CRM to Power BI using AI-generated custom connector. Fantastic! Until the CRM vendor updates their API three months later and everything breaks.
Why? The AI Cowboy has moved to other clients. Your team has no documentation, doesn't understand connector logic, and can't fix it without rebuilding from scratch.
Cost Impact: Emergency rebuild costs $18,000. Business operates without CRM insights for 6 weeks during fix.
Scenario 3: The Security Vulnerability
AI-generated row-level security appears functional—managers see only their team's data. Perfect! Except implementation contains subtle flaws where certain filter combinations expose unauthorised information.
Discovery Timing: Found during compliance audit—or worse, after a data breach.
Cost Impact: Regulatory fines ($50,000-$500,000), legal liability, reputational damage destroying customer trust, mandatory system shutdown until remediation.
Scenario 4: The Unmaintainable Solution
Dashboard launches successfully. Business requirements change (as they always do). You need additional calculations, modified visuals, or new data source integration.
The Problem: Code lacks comments. Data model is convoluted. Naming conventions are inconsistent. Nobody understands design decisions.
Your Options: Pay more to reverse-engineer and rebuild, or start completely over.
Cost Impact: Either approach costs more than proper initial development would have.
Real Cost Comparison: 12-Month View
AI Cowboy Approach:
- Initial Development: $15,000
- Post-Launch Performance Issues: $8,000
- Security Remediation: $12,000
- Broken Integration Repair: $10,000
- Complete Rebuild After 12 Months: $35,000
- Total: $80,000 plus massive business disruption
C9 Professional Approach:
- Discovery: $18,000
- Expert Development: $42,000
- Testing and Documentation: $7,000
- Knowledge Transfer: $6,000
- 12-Month Proactive Maintenance: $9,000
- Total: $82,000 with zero disruption and sustainable asset
Nearly identical total costs—but C9 delivers maintainable solutions providing value for years whilst AI Cowboy creates money pits requiring constant emergency fixes.
Questions Exposing AI Cowboys
1. "Explain your data modelling approach and why you make specific design decisions."
AI Cowboy: Vague "best practices" references
C9: Detailed star schema explanation, grain determination, relationship optimisation specific to requirements
2. "How do you handle security and compliance for Australian businesses?"
AI Cowboy: "We follow Microsoft recommendations"
C9: Specific security architecture, compliance framework implementation, Australian Privacy Principles adherence, industry regulation understanding
3. "Provide references from clients maintaining solutions you built 12+ months ago."
AI Cowboy: Only recent projects or vague references
C9: Long-term relationships with solutions performing well years later
C9's Competitive Advantage in the Australian Market
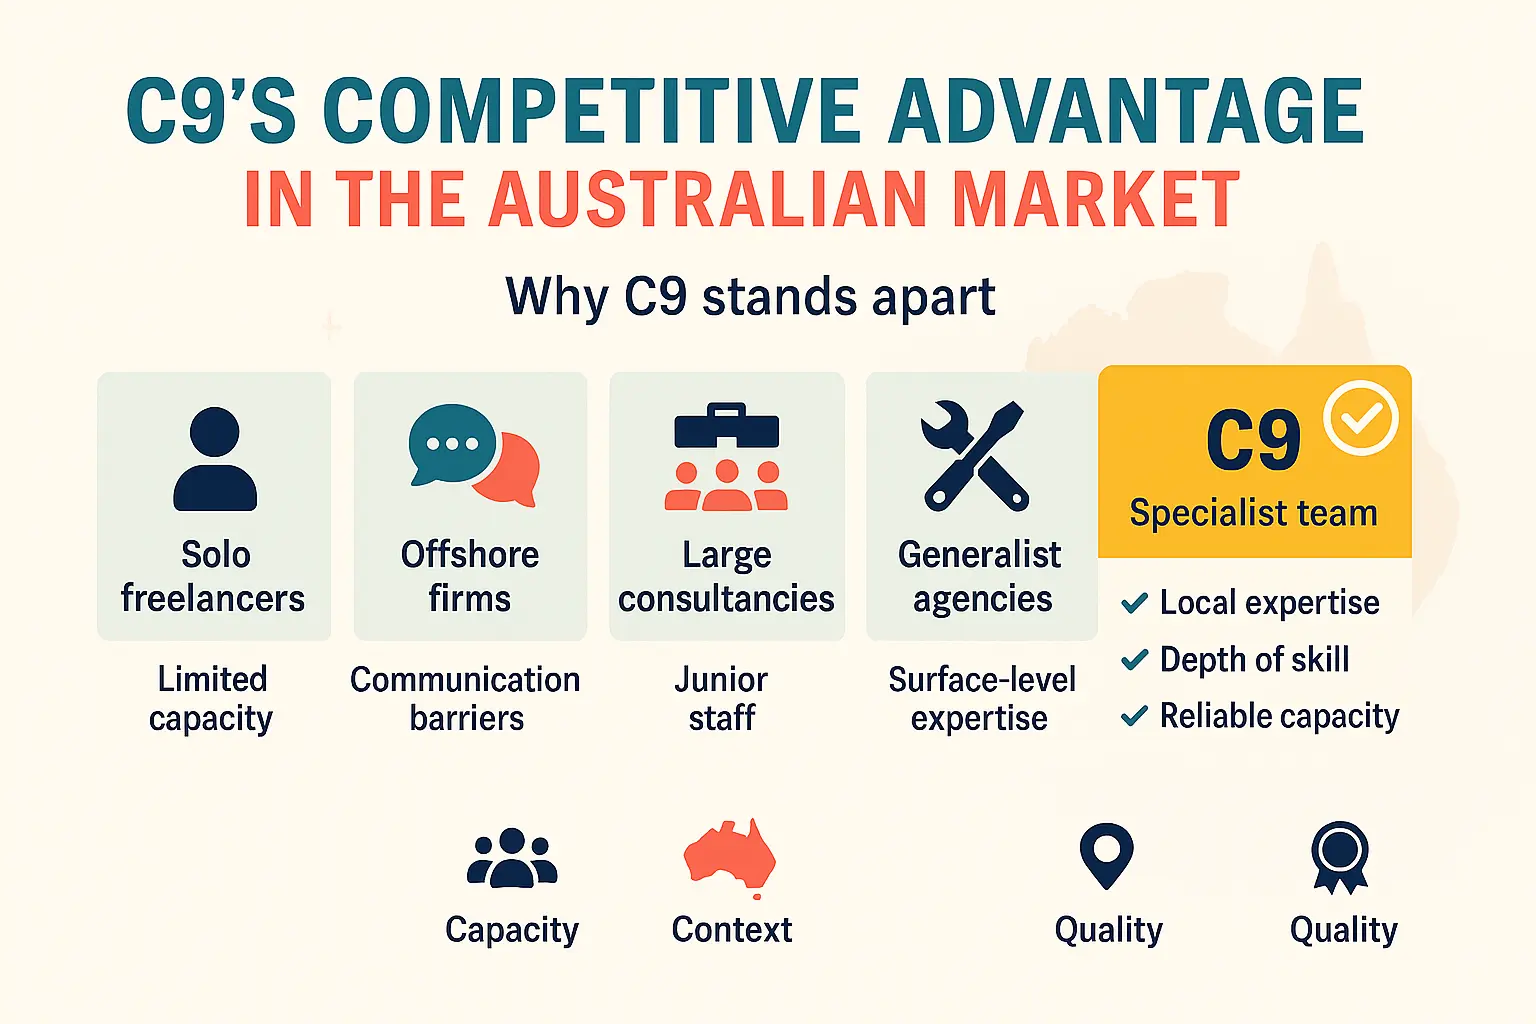
Why C9 Stands Apart from Hundreds of Competitors
Australia hosts hundreds of developers, freelancers, and consulting firms offering Power BI services. Most fall into predictable categories:
C9 operates differently through strategic advantages delivering superior outcomes.
Advantage #1: Blended Hybrid Onshore/Offshore Model
Pure Onshore Problem: Australian-based development is prohibitively expensive. Senior Power BI developers command $150-$200+ hourly. Complex projects quickly reach $300,000-$500,000—beyond most mid-market budgets.
Pure Offshore Problem: Seems cost-effective initially but creates frustrations—time zone delays, cultural gaps, no Australian regulatory knowledge, no local presence for workshops, language barriers.
C9's Blended Solution: Strategic combination of onshore Australian leadership with offshore technical delivery:
Onshore (Australian-Based):
- Solution architects understanding Australian business contexts
- Project managers in your time zone for daily communication
- Business analysts conducting stakeholder workshops
- Compliance specialists ensuring regulatory adherence
- Training facilitators for knowledge transfer
Offshore (C9's Directly Hired Teams):
- Senior developers building to onshore specifications
- Data engineers implementing integration pipelines
- QA specialists conducting comprehensive testing
- UI/UX designers creating intuitive dashboards
Result: Enterprise-grade expertise at 30-50% lower cost than pure onshore whilst maintaining quality and Australian market understanding pure offshore can't match.
Advantage #2: Comprehensive Knowledge Transfer
Most consultancies optimise for billable hours, creating perverse incentives—complicated solutions requiring ongoing support, minimal documentation forcing continued paid assistance, little training investment, dependency benefiting consultant rather than client.
C9's Philosophy: Success measured by client independence, not dependency.
What C9 Provides:
Documentation: Solution architecture diagrams, data model documentation, integration flow maps, security configurations, troubleshooting guides, deployment procedures
Training: Role-specific programs for administrators/analysts/users, hands-on workshops with actual dashboards, recording libraries, best practices guides
Advisory Support: Post-launch consultation, monthly optimisation reviews, specialist access for complex issues, proactive Power BI update notifications
Transition Planning: Phased handover building confidence gradually, documentation review confirming understanding, supervised independent changes before full autonomy
Advantage #3: Integrated Teams (Not Solo Developers)
Single Developer Risk: Projects stall when sick/on holiday/quits, single skillset creates gaps, no peer review catches errors, knowledge exists in one head.
C9's Team Approach: Every project includes multiple specialists—Solution Architect, Lead Developer, Data Engineer, BI Developer, QA Specialist, Project Manager, Business Analyst.
Benefits: No single points of failure, peer review quality, comprehensive expertise, faster delivery through parallel work, knowledge redundancy.
Important: C9 operates with remote workers, not in-office staff. We don't provide "bums on seats" at your location. Our team works flexibly across time zones delivering results, not presenteeism.
Advantage #4: Skills-Based Pricing
Industry Problem: Flat hourly rates charging same for juniors or senior architects, day rates penalising efficiency, fixed-price packages with rigid scope.
C9's Model: Different rates for different expertise:
- Junior Developers: $85-$110/hour
- Mid-Level Developers: $120-$145/hour
- Senior Developers/Specialists: $160-$190/hour
- Solution Architects: $195-$225/hour
Blended Rate Advantage: Most projects use mixed skill levels, creating $125-$155/hour blended rates—significantly less than competitors' $180-$220/hour flat rates.
FY25/26 Rates (subject to CPI): Assume blended onshore/offshore mix, long-term and multi-resource discounts available, monthly packages scalable with notice periods, unused hours roll over.
Staff Augmentation: Flexible Expertise Without Hiring Risk
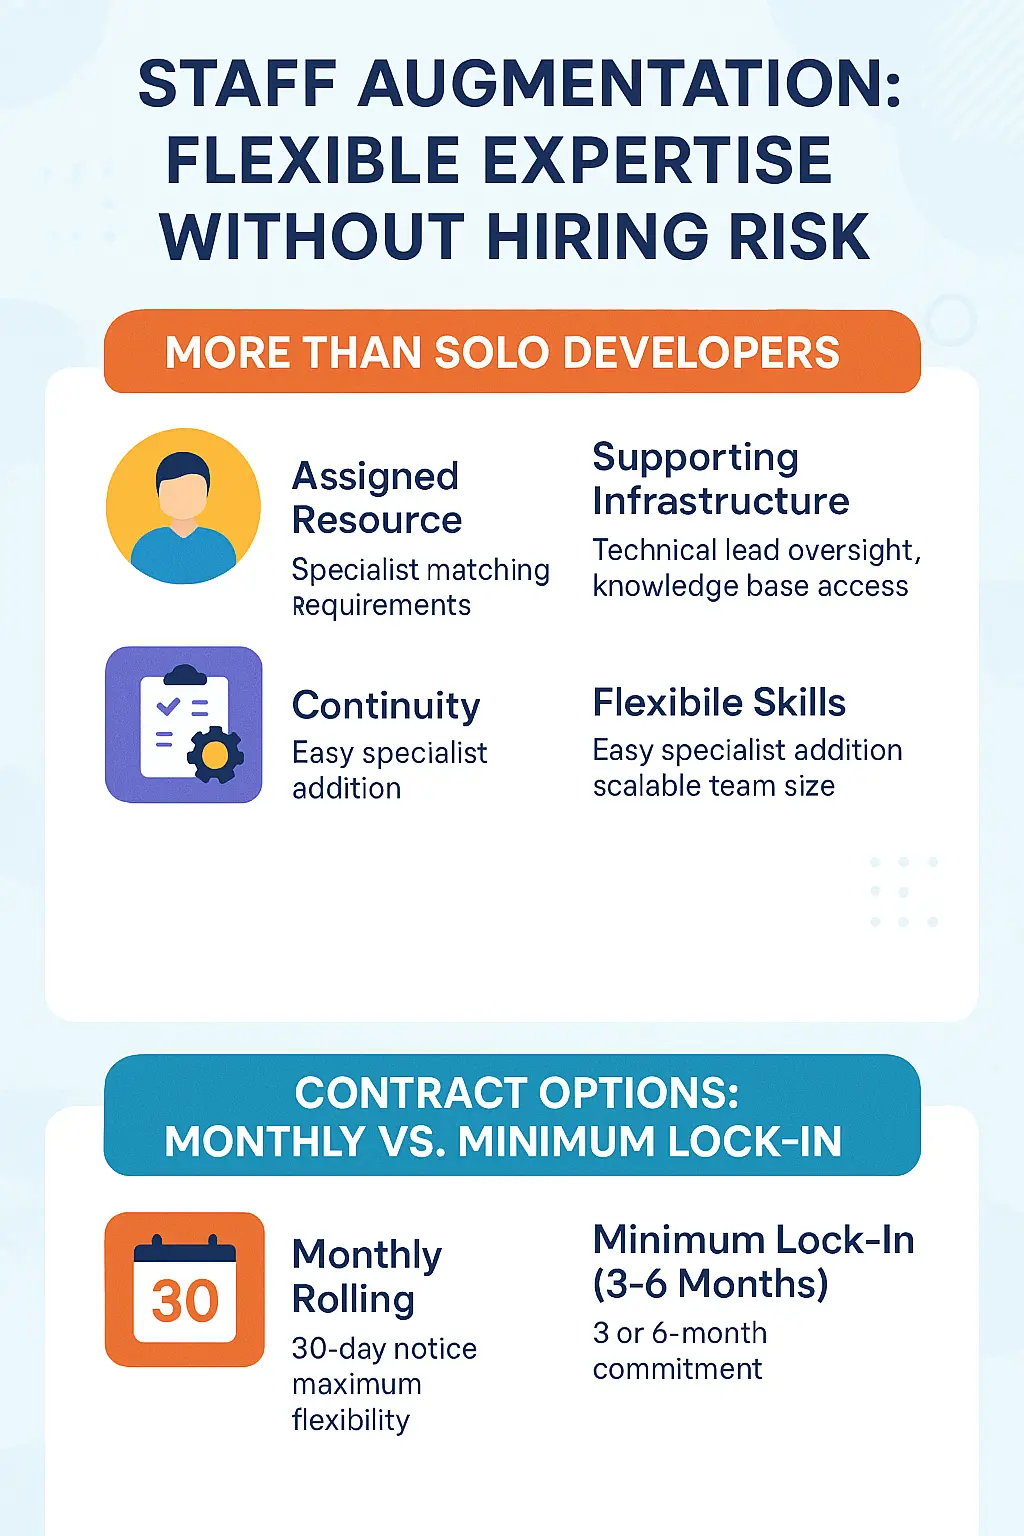
More Than Solo Developers
C9's staff augmentation provides integrated team members backed by full support infrastructure:
Assigned Resource: Specialist matching requirements, onboarded with your systems, available during business hours, integrated into teams
Supporting Infrastructure: Technical lead oversight, peer review, knowledge base access, escalation path for complex issues
Continuity: Coverage during leave, smooth transitions if needed, institutional knowledge retained within C9
Flexible Skills: Easy specialist addition, scalable team size, optimised skill level mix
Contract Options: Monthly vs. Minimum Lock-In
Monthly Rolling: 30-day notice, best for evaluation/short projects, standard rates, maximum flexibility
Minimum Lock-In (3-6 Months): 3 or 6-month commitment, best for substantive projects, 10-15% discount, scale up anytime
Why Minimum Lock-In Delivers Better Outcomes
Better Resource Commitment: Resources invest deeply understanding your business versus uncertain monthly engagements
Cost Efficiency: 10-15% discount—on 6-month engagement at $140/hour for 160 hours/month saves $13,440-$20,160
Continuity Value: Peak productivity in months 5-6 far exceeds months 1-2
Strategic Planning: Confidence in resource availability enables proper phased roadmaps
Knowledge Retention: Sufficient time for comprehensive transfer and documentation
Key Staff Augmentation FAQs
Q: Will resources work from our office?
A: No, C9 operates remotely with flexible hours overlapping Australian business time for collaboration.
Q: How quickly can resources start?
A: Typically 1-2 weeks including selection, provisioning, and onboarding.
Q: Can we scale the team during contracts?
A: Scale up anytime with 1-2 weeks' notice. Scale down at renewal periods or with mutual agreement.
Q: What if the resource isn't a good fit?
A: Replacement within first 2 weeks at no cost. After that, collaborative resolution through training, adjustment, or replacement.
Pricing Truth: Why Indicative Quotes Destroy Projects
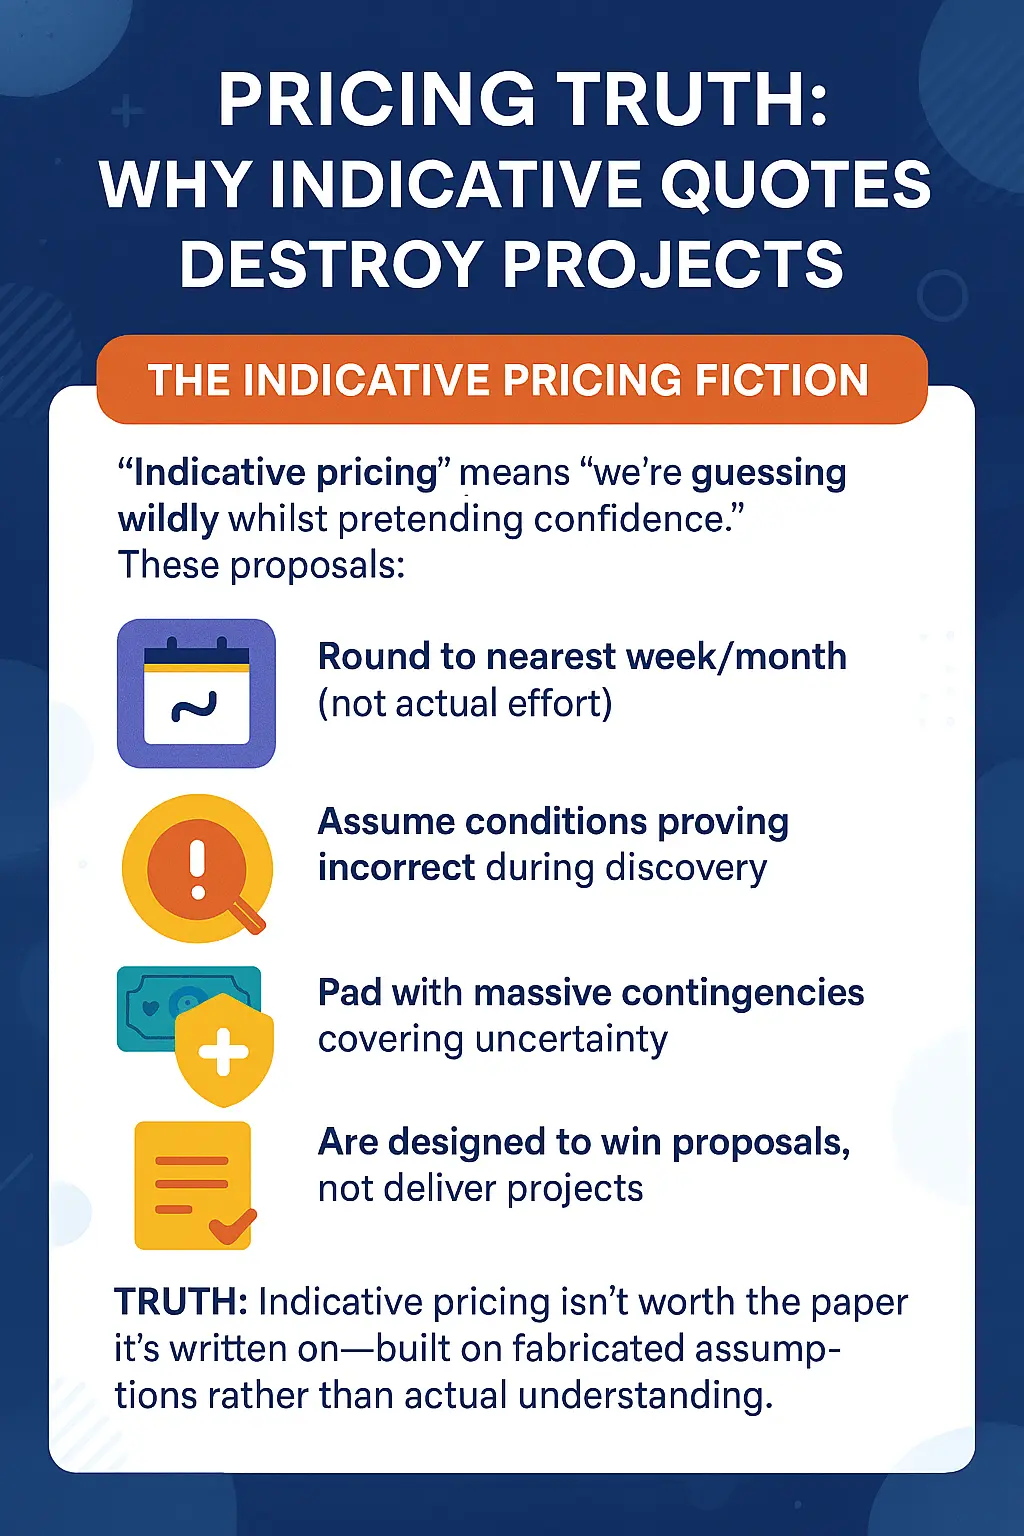
The Indicative Pricing Fiction
"Indicative pricing" means "we're guessing wildly whilst pretending confidence." These proposals:
Truth: Indicative pricing isn't worth the paper it's written on—built on fabricated assumptions rather than actual understanding.
Discovery-Based Pricing: Real Example
Retail Analytics Scenario
Indicative Quote: $65,000, 8 weeks
Unstated Assumptions: Clean POS data, single system, 5-10 reports, no real-time requirements, basic permissions
Discovery Findings: POS data across 3 systems, 18 months historical cleaning needed, 25 report types requested, real-time inventory required, complex franchisee permissions, mobile optimisation, external competitor data integration
Accurate Phased Pricing:
Phase 1 (Foundation): 6 weeks, $48,000
- Primary POS integration
- 8 critical reports
- Basic security
- Executive dashboards
Phase 2 (Expansion): 4 weeks, $32,000
- Additional POS systems
- Remaining reports
- Mobile optimisation
- Franchisee access
Phase 3 (Advanced): 3 weeks, $24,000
- Real-time inventory
- Competitor pricing
- Predictive analytics
Total: $104,000, 13 weeks across phases
Why Better: Phases deliver early ROI, budget control, realistic timeline, accurate costing, informed decisions
Breaking Projects into Stages
Smart phasing delivers value quickly, proves concepts, funds future development with operational savings, reduces risk per investment, enables learning, maintains momentum.
Financial Services Example: Four phases totalling $234,000 versus $385,000 big-bang approach. Phase 1-2 savings ($48,000/month) fund phases 3-4. Total savings: $151,000 (39%).
Taking Action: Your Path to Analytics Excellence
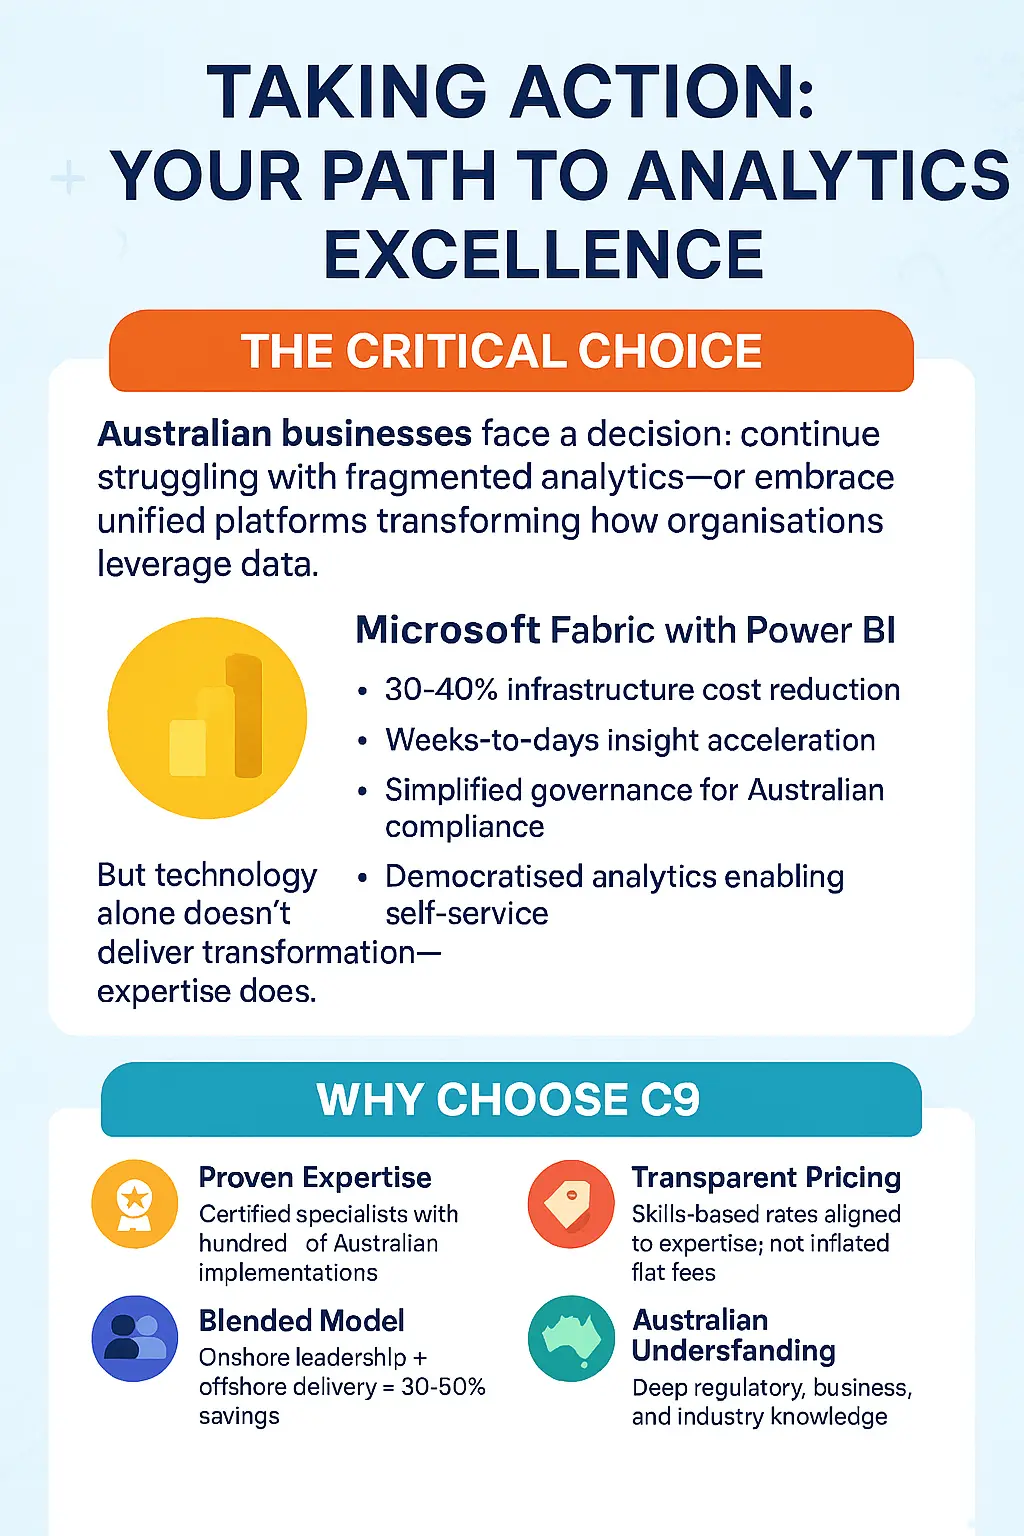
The Critical Choice
Australian businesses face a decision: continue struggling with fragmented analytics—or embrace unified platforms transforming how organisations leverage data.
Microsoft Fabric with Power BI delivers:
- 30-40% infrastructure cost reduction
- Weeks-to-days insight acceleration
- Simplified governance for Australian compliance
- Democratised analytics enabling self-service
- Future-proof scalable architecture
But technology alone doesn't deliver transformation—expertise does.
Why Choose C9
Proven Expertise: Certified specialists with hundreds of Australian implementations
Blended Model: Onshore leadership + offshore delivery = 30-50% savings
Knowledge Transfer: Comprehensive documentation, training, and support building capability
Integrated Teams: Multiple specialists with peer review eliminating dependencies
Transparent Pricing: Skills-based rates aligned to expertise, not inflated flat fees
Australian Understanding: Deep regulatory, business, and industry knowledge
Your Next Steps
Step 1: Book Discovery Consultation (No Cost)
60-minute session discussing challenges, objectives, Fabric suitability, discovery process, expected ROI
Step 2: Invest in Discovery ($12,000-$25,000)
2-3 weeks comprehensive assessment delivering accurate pricing and phased roadmap
Step 3: Execute Phased Implementation
Begin with highest-value Phase 1 delivering results in 4-8 weeks. Use savings to fund subsequent phases.
Contact C9 Today
Website: www.c9.com.au
Location: Proudly Australian-owned, serving businesses nationwide
Book your complimentary discovery consultation exploring how Microsoft Fabric and Power BI transform analytics capabilities. No obligation, no pressure—just expert guidance.
Limited Availability: C9's senior consultants have capacity for 3-4 new discovery engagements monthly. Book now to secure your slot.
The path to analytics excellence begins with one conversation. Take that step today.